


April 27, 2024 Alphabet and Microsoft’s AI Investments Yield Strong Returns
April 26, 2024 Top 10 High Dividend Yield Stocks

Tesla Q1: Model 2 Could Be Their Model T


Tesla Is An AI Company That The Market Won’t Reward For Now

Amazon: The Margin Train Is Gaining Speed

April 23, 2024 Maximizing Profits: When is the Right Time to Sell Your Business?

April 12, 2024 Improve Your Financial Status: A How-To Guide
April 12, 2024 How ZIM Integrated Container Tracking is Revolutionizing Global Trade

March 15, 2024 6 Best Growth Stocks To Buy Now According to Metatrader 5

Starbucks (SBUX) Stock Forecast for 2024–2028. Sell or Buy?
Updated: April 26, 2024 (13:00)
Sector: Counsumer cyclicalThe share price of Starbucks Corp. (SBUX) now
50/200 Day Moving Average: $90.64 / $95.36
This figure corresponds to the Average Price over the previous 50/200 days. For Starbucks stocks, the 50-day moving average is the resistance level today.
For Starbucks stocks, the 200-day moving average is the resistance level today.
Are you interested in Starbucks Corp. stocks and want to buy them, or are they already in your portfolio? If yes, then on this page you will find useful information about the dynamics of the Starbucks stock price in 2024, 2025, 2026, 2027, 2028. How much will one Starbucks share be worth in 2024 - 2028?
When should I take profit in Starbucks stock? When should I record a loss on Starbucks stock? What are analysts' forecasts for Starbucks stock? What is the future of Starbucks stock? We forecast Starbucks stock performance using neural networks based on historical data on Starbucks stocks. Also, when forecasting, technical analysis tools are used, world geopolitical and news factors are taken into account.
Starbucks stock prediction results are shown below and presented in the form of graphs, tables and text information, divided into time intervals. (Next month, 2024, 2025, 2026, 2027 and 2028) The final quotes of the instrument at the close of the previous trading day are a signal to adjust the forecasts for Starbucks shares. This happens once a day.
Historical and forecast chart of Starbucks stock
The chart below shows the historical price of Starbucks stock and a prediction chart for the next month. For convenience, prices are divided by color. Forecast prices include: Optimistic Forecast, Pessimistic Forecast, and Weighted Average Best Forecast. Detailed values for the Starbucks stock price can be found in the table below.
Long-term forecasts by years.

Unlocking Starbucks' Stock Potential: A Dive into Forecasted Rates

As the SBUX stock forecast becomes a focal point for investors, understanding the pivotal factors influencing Starbucks' stock rate is paramount. The trajectory of SBUX stock prices hinges on several key elements, including earnings growth, dividend yield, dividend growth rate, and business maturity. Each of these plays a crucial role in crafting an informed SBUX stock buy or sell decision.
Cracking the Code: Predictive Insights on SBUX Stocks
Earnings growth emerges as the linchpin, suggesting that Starbucks' continued profitability is a beacon for potential stock price appreciation. Analysts eyeing the Starbucks stock forecast will find this indicator especially useful for predicting future trends. Similarly, the dividend yield and growth rate are not just numbers but narratives of Starbucks' commitment to shareholder value, making the is SBUX a good stock to buy question a bit easier to answer. Whether contemplating the current SBUX stock price prediction or gauging the SBUX stock price target, these factors offer a roadmap.
- Earnings Growth: A spotlight on future profitability
- Dividend Yield and Growth Rate: Why SBUX could be your next income stock
- Business Maturity: Stability meets growth, impacting SBUX stock buy or sell strategies
For analysts crafting a Starbucks name stock forecast, weaving these considerations into their prognoses could demystify the SBUX stock price prediction. Whether leaning towards a buy or sell Starbucks stock stance, the blend of these factors, from why SBUX stock down queries to more optimistic outlooks, paves the way for making well-informed decisions.
Review the original Analysis
Starbucks (SBUX) Stock Forecast: Brewing up a Storm of Opportunity

For investors pondering whether to buy or sell Starbucks stock, understanding the forecast for SBUX stock prices is crucial. A blend of key factors is set to influence SBUX stock rates, with top-line growth, margin expansion, and the company's ambitious reinvention strategy earmarked as pivotal influencers. These elements hold the power not only to sway SBUX stock prices but also to provide savvy analysts with the ingredients needed for crafting detailed SBUX stock price predictions.
Factors Stirring the Pot
When it comes to the SBUX stock forecast, the company's consistent top-line growth emerges as the primary catalyst. This is a testament to Starbucks' brand strength and its ability to attract and retain customers, crucial for driving SBUX stock price predictions upwards. Following closely is margin expansion, a clear indicator of Starbucks' operational efficiency and profitability—elements that when boiled down, highly motivate an investment decision towards SBUX being a good stock to buy. Lastly, the "Triple Shot" reinvention strategy, which focuses on digital capabilities, brand reputation, and global market penetration, promises to unlock new growth avenues and cost savings. This ambitious plan is not just stirring interest but also acts as a solid foundation for any SBUX stock price target.
For analysts aiming to navigate the ever-changing waters of SBUX stock rates, factoring in these critical influencers can provide a more refined Starbucks stock forecast. By critically assessing how Starbucks’ growth, efficiency, and strategic shifts are likely to play out, analysts can generate more accurate SBUX stock buy or sell recommendations for scrupulous investors looking to capitalize on Starbucks' next wave of growth.
- Top-line Growth
- Margin Expansion
- Company's Reinvention Strategy
In a nutshell, for those speculating about SBUX stock buy or sell dynamics, taking a deep dive into these factors could illuminate whether SBUX is a good stock to buy. As the company brews its ambitious plans, the SBUX stock price prediction appears not just warm but potentially steaming with opportunities for discerning investors eager to ride the wave of Starbucks’ solid growth trajectory.
Review the original Analysis
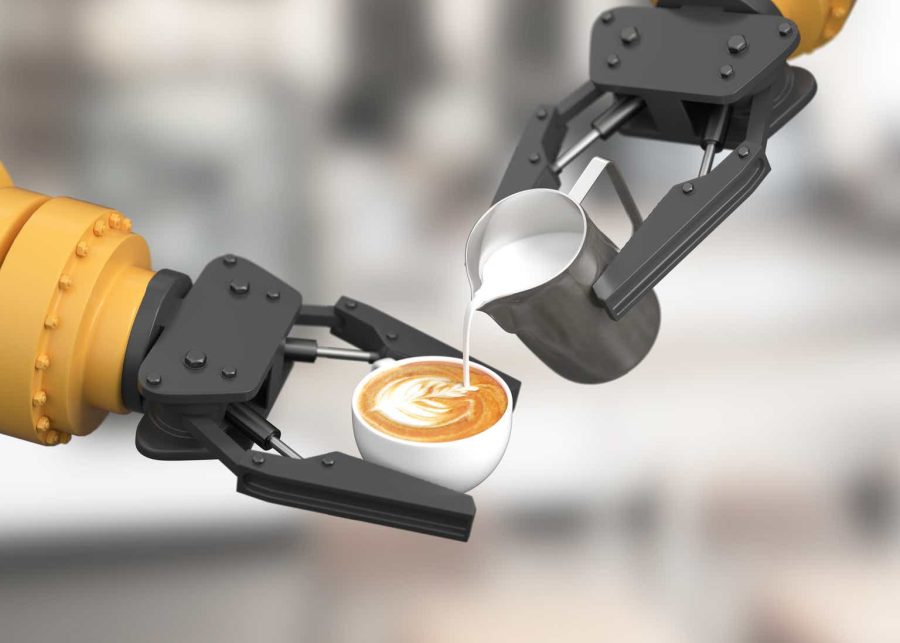
Unlocking the Future of SBUX: A Deep Dive into Stock Predictions
When it comes to forecasting the future of Starbucks (SBUX) stock rates, analysts are closely watching a blend of factors that could significantly influence the company's valuation. Among the myriad considerations, automation stands out as a transformative force. The integration of robotics in operations, particularly in beverage production, heralds substantial cost savings. By minimizing payroll expenses and boosting efficiency, automation could dramatically enhance Starbucks' free cash flow, making the SBUX stock forecast more promising than ever.
The Analyst's Toolkit: Predicting SBUX's Stock Trajectory
To make the most accurate predictions regarding SBUX's stock trajectory, analysts are leaning heavily on a comprehensive analysis that includes the company's financial history, valuation, size, buybacks, and the pivotal impact of automation. This multidimensional approach sheds light on:
- The robustness of Starbucks' financial performance, emphasizing revenue growth and cash flow trends.
- The valuation of SBUX stock, utilizing models that factor in free cash flow, growth rate, and terminal multiple, to discern whether SBUX is a good stock to buy at its current price.
- The scalability challenge posed by Starbucks' extensive global footprint, which could potentially limit store expansion and affect the SBUX stock price prediction.
- The strategic role of share buybacks and dividends in enhancing shareholder value, influencing debates around SBUX stock buy or sell decisions.
- And crucially, the anticipated cost efficiencies from automation, which are expected to significantly impact the SBUX stock price target and forecasts.
For those pondering whether to buy or sell Starbucks stock, understanding these critical dimensions offers a nuanced perspective. It's not just about whether the SBUX stock is down or up in the short term; it's about grasping the transformative potential of technologies and strategic decisions that could redefine the coffee giant's future. The quest to forecast SBUX stock rates accurately is a complex blend of art and science, heavily reliant on analyzing emerging trends such as automation and their long-term implications for shareholder value.
Review the original Analysis
Starbucks Corporation is an American coffee company and coffee chain of the same name, and is the market leader globally. Today it is one of the most famous brands both in the USA and around the world. As of the end of 2014, about 21.3 thousand Starbucks coffee shops were opened.
Starbucks daily forecast for a month
| Date | Target | Pes. | Opt. | Vol., % |
|---|---|---|---|---|
| Apr 28 | 89.91 | 88.90 | 90.75 | 2.08 |
| Apr 29 | 89.08 | 88.58 | 90.08 | 1.69 |
| Apr 30 | 88.99 | 87.69 | 89.56 | 2.13 |
| May 01 | 88.01 | 86.73 | 88.86 | 2.46 |
| May 02 | 87.68 | 86.64 | 88.94 | 2.65 |
| May 03 | 87.62 | 86.57 | 88.45 | 2.17 |
| May 04 | 87.82 | 86.90 | 88.54 | 1.88 |
| May 05 | 87.18 | 86.09 | 87.97 | 2.19 |
| May 06 | 87.52 | 86.27 | 88.67 | 2.78 |
| May 07 | 87.43 | 86.57 | 88.58 | 2.32 |
| May 08 | 87.60 | 86.34 | 88.08 | 2.01 |
| May 09 | 88.51 | 87.89 | 88.92 | 1.17 |
| May 10 | 87.75 | 86.45 | 88.91 | 2.84 |
| May 11 | 88.44 | 88.08 | 88.95 | 0.98 |
| May 12 | 88.22 | 86.94 | 89.34 | 2.76 |
| May 13 | 88.79 | 88.22 | 89.25 | 1.17 |
| May 14 | 88.31 | 87.44 | 88.84 | 1.60 |
| May 15 | 88.08 | 86.86 | 88.73 | 2.15 |
| May 16 | 87.73 | 86.68 | 88.11 | 1.66 |
| May 17 | 86.76 | 85.44 | 87.84 | 2.80 |
| May 18 | 86.95 | 85.56 | 88.22 | 3.11 |
| May 19 | 86.21 | 85.74 | 87.03 | 1.51 |
| May 20 | 85.55 | 85.00 | 86.51 | 1.77 |
| May 21 | 86.92 | 86.12 | 87.65 | 1.78 |
| May 22 | 87.48 | 86.90 | 88.54 | 1.89 |
| May 23 | 88.91 | 88.04 | 89.84 | 2.04 |
| May 24 | 87.99 | 87.32 | 89.04 | 1.97 |
| May 25 | 88.78 | 88.17 | 89.24 | 1.21 |
| May 26 | 87.07 | 86.15 | 87.60 | 1.68 |
| May 27 | 86.31 | 85.82 | 87.34 | 1.77 |
Starbucks Daily Price Targets
Starbucks Stock Forecast 04-28-2024.
Forecast target price for 04-28-2024: $89.91.
Positive dynamics for Starbucks shares will prevail with possible volatility of 2.041%.
Pessimistic target level: 88.90
Optimistic target level: 90.75
Starbucks Stock Forecast 04-29-2024.
Forecast target price for 04-29-2024: $89.08.
Negative dynamics for Starbucks shares will prevail with possible volatility of 1.661%.
Pessimistic target level: 88.58
Optimistic target level: 90.08
Starbucks Stock Forecast 04-30-2024.
Forecast target price for 04-30-2024: $88.99.
Negative dynamics for Starbucks shares will prevail with possible volatility of 2.087%.
Pessimistic target level: 87.69
Optimistic target level: 89.56
Starbucks Stock Forecast 05-01-2024.
Forecast target price for 05-01-2024: $88.01.
Negative dynamics for Starbucks shares will prevail with possible volatility of 2.397%.
Pessimistic target level: 86.73
Optimistic target level: 88.86
Starbucks Stock Forecast 05-02-2024.
Forecast target price for 05-02-2024: $87.68.
Negative dynamics for Starbucks shares will prevail with possible volatility of 2.583%.
Pessimistic target level: 86.64
Optimistic target level: 88.94
Starbucks Stock Forecast 05-03-2024.
Forecast target price for 05-03-2024: $87.62.
Negative dynamics for Starbucks shares will prevail with possible volatility of 2.120%.
Pessimistic target level: 86.57
Optimistic target level: 88.45
SBUX (SBUX) Monthly Stock Prediction for 2024
| Month | Target | Pes. | Opt. | Vol., % |
|---|---|---|---|---|
| May. | 90.12 | 87.28 | 92.07 | 5.21 |
| Jun. | 88.79 | 87.42 | 92.71 | 5.70 |
| Jul. | 88.42 | 84.95 | 91.64 | 7.29 |
| Aug. | 82.35 | 78.84 | 83.56 | 5.66 |
| Sep. | 81.60 | 77.89 | 84.52 | 7.84 |
| Oct. | 80.46 | 77.98 | 82.04 | 4.94 |
| Nov. | 84.29 | 80.45 | 87.54 | 8.09 |
| Dec. | 85.35 | 84.10 | 89.41 | 5.95 |
Starbucks forecast for this year
Starbucks Stock Prediction for May 2024
An uptrend is forecast for this month with an optimal target price of $90.1151. Pessimistic: $87.28. Optimistic: $92.07
Starbucks Stock Prediction for Jun 2024
An downtrend is forecast for this month with an optimal target price of $88.7904. Pessimistic: $87.42. Optimistic: $92.71
Starbucks Stock Prediction for Jul 2024
An downtrend is forecast for this month with an optimal target price of $88.4174. Pessimistic: $84.95. Optimistic: $91.64
Starbucks Stock Prediction for Aug 2024
An downtrend is forecast for this month with an optimal target price of $82.352. Pessimistic: $78.84. Optimistic: $83.56
Starbucks Stock Prediction for Sep 2024
An downtrend is forecast for this month with an optimal target price of $81.6026. Pessimistic: $77.89. Optimistic: $84.52
Starbucks Stock Prediction for Oct 2024
An downtrend is forecast for this month with an optimal target price of $80.4602. Pessimistic: $77.98. Optimistic: $82.04
Starbucks Stock Prediction for Nov 2024
An uptrend is forecast for this month with an optimal target price of $84.2901. Pessimistic: $80.45. Optimistic: $87.54
Starbucks Stock Prediction for Dec 2024
An uptrend is forecast for this month with an optimal target price of $85.3521. Pessimistic: $84.10. Optimistic: $89.41
Starbucks (SBUX) Monthly Stock Prediction for 2025
| Month | Target | Pes. | Opt. | Vol., % |
|---|---|---|---|---|
| Jan | 85.11 | 81.66 | 86.54 | 5.65 |
| Feb | 85.59 | 81.16 | 87.57 | 7.32 |
| Mar | 87.87 | 84.48 | 90.27 | 6.41 |
| Apr | 89.04 | 84.73 | 91.72 | 7.61 |
| May | 91.59 | 89.92 | 95.63 | 5.97 |
| Jun | 96.01 | 93.06 | 98.90 | 5.91 |
| Jul | 101.06 | 98.08 | 105.09 | 6.66 |
| Aug | 100.14 | 96.84 | 104.69 | 7.50 |
| Sep | 106.51 | 102.12 | 110.69 | 7.75 |
| Oct | 102.94 | 99.98 | 107.11 | 6.66 |
| Nov | 101.57 | 98.44 | 103.84 | 5.20 |
| Dec | 98.15 | 93.48 | 101.80 | 8.17 |
Starbucks (SBUX) Monthly Stock Prediction for 2026
| Month | Target | Pes. | Opt. | Vol., % |
|---|---|---|---|---|
| Jan | 96.50 | 93.06 | 98.60 | 5.62 |
| Feb | 93.87 | 91.31 | 95.91 | 4.80 |
| Mar | 95.45 | 91.44 | 98.19 | 6.87 |
| Apr | 96.78 | 94.41 | 102.07 | 7.50 |
| May | 101.32 | 97.92 | 106.43 | 8.00 |
| Jun | 100.26 | 96.89 | 102.50 | 5.48 |
| Jul | 104.96 | 103.34 | 108.56 | 4.81 |
| Aug | 104.30 | 100.50 | 108.83 | 7.65 |
| Sep | 106.49 | 104.70 | 111.71 | 6.27 |
| Oct | 103.81 | 101.70 | 105.91 | 3.98 |
| Nov | 100.97 | 99.28 | 102.60 | 3.24 |
| Dec | 106.70 | 103.78 | 108.86 | 4.67 |
Starbucks (SBUX) Monthly Stock Prediction for 2027
| Month | Target | Pes. | Opt. | Vol., % |
|---|---|---|---|---|
| Jan | 113.64 | 108.23 | 117.22 | 7.67 |
| Feb | 114.20 | 110.28 | 118.12 | 6.63 |
| Mar | 110.20 | 105.19 | 114.14 | 7.84 |
| Apr | 113.13 | 111.08 | 115.27 | 3.64 |
| May | 109.65 | 106.89 | 113.26 | 5.62 |
| Jun | 113.49 | 107.21 | 118.57 | 9.58 |
| Jul | 110.95 | 105.28 | 115.76 | 9.06 |
| Aug | 103.34 | 101.31 | 107.46 | 5.72 |
| Sep | 101.53 | 98.75 | 106.43 | 7.21 |
| Oct | 99.89 | 97.65 | 104.51 | 6.56 |
| Nov | 99.61 | 97.73 | 103.45 | 5.53 |
| Dec | 99.05 | 93.65 | 101.41 | 7.66 |
Starbucks (SBUX) Monthly Stock Prediction for 2028
| Month | Target | Pes. | Opt. | Vol., % |
|---|---|---|---|---|
| Jan | 98.08 | 93.83 | 102.20 | 8.20 |
| Feb | 104.13 | 99.90 | 108.06 | 7.55 |
| Mar | 110.03 | 103.87 | 111.65 | 6.97 |
| Apr | 117.65 | 113.70 | 123.75 | 8.12 |
| May | 114.11 | 107.96 | 118.83 | 9.14 |
| Jun | 121.30 | 117.40 | 123.93 | 5.28 |
| Jul | 117.74 | 113.12 | 121.45 | 6.85 |
| Aug | 111.14 | 107.88 | 112.85 | 4.41 |
| Sep | 107.49 | 102.29 | 109.52 | 6.60 |
| Oct | 104.33 | 100.68 | 106.96 | 5.87 |
| Nov | 107.83 | 106.10 | 111.45 | 4.81 |
| Dec | 108.96 | 104.08 | 113.24 | 8.08 |
Starbucks information and performance
P O BOX 34067, SEATTLE, WA, US
Market capitalization of the Starbucks Corp. is the total market value of all issued shares of a company. It is calculated by the formula multiplying the number of SBUX shares in the company outstanding by the market price of one share.
EBITDA of Starbucks is earnings before interest, income tax and depreciation of assets.
P/E ratio (price to earnings) - shows the ratio between the price of a share and the company's profit
Price/earnings to growth
Dividend Per Share is a financial indicator equal to the ratio of the company's net profit available for distribution to the annual average of ordinary shares.
Dividend yield is a ratio that shows how much a company pays in dividends each year at the stock price.
EPS shows how much of the net profit is accounted for by the common share.
Trailing P/E depends on what has already been done. It uses the current share price and divides it by the total earnings per share for the last 12 months.
Forward P/E uses projections of future earnings instead of final numbers.
Enterprise Value (EV) /Revenue
The EV / EBITDA ratio shows the ratio of the cost (EV) to its profit before tax, interest and amortization (EBITDA).
Number of issued ordinary shares
Number of freely tradable shares
Shares Short Prior Month - the number of shares in short positions in the last month.
Starbucks (SBUX) stock dividend
Starbucks last paid dividends on 05/16/2024. The next scheduled payment will be on 05/31/2024. The amount of dividends is $2.2 per share. If the date of the next dividend payment has not been updated, it means that the issuer has not yet announced the exact payment. As soon as information becomes available, we will immediately update the data. Bookmark our portal to stay updated.
Last Split Date: 01/01/1970
Splitting of shares is an increase in the number of securities of the issuing company circulating on the market due to a decrease in their value at constant capitalization.
For example, a 5: 1 ratio means that the value of one share will decrease 5 times, the total amount will increase 5 times. It is important to understand that this procedure does not change the capitalization of the company, as well as the total value of assets held in private hands.