


July 14, 2024 This Week Top S&P 500 Gainers & Losers

Tesla Q2: The Bottom Is Likely In


Tesla: Time To Take Profits

Microsoft: The Q4 Results Should Surprise You

Tesla: Optimus And FSD Probably Won’t Save The Day

April 23, 2024 Maximizing Profits: When is the Right Time to Sell Your Business?

April 12, 2024 Improve Your Financial Status: A How-To Guide
April 12, 2024 How ZIM Integrated Container Tracking is Revolutionizing Global Trade

March 15, 2024 6 Best Growth Stocks To Buy Now According to Metatrader 5

Bank of America (BAC) Stock Forecast for 2024–2028. Sell or Buy?
Updated: July 27, 2024 (03:54)
Sector: FinancialThe share price of Bank of America Corp. (BAC) now
50/200 Day Moving Average: $40.31 / $34.83
This figure corresponds to the Average Price over the previous 50/200 days. For Bank of America stocks, the 50-day moving average is the support level today.
For Bank of America stocks, the 200-day moving average is the support level today.
Are you interested in Bank of America Corp. stocks and want to buy them, or are they already in your portfolio? If yes, then on this page you will find useful information about the dynamics of the Bank of America stock price in 2024, 2025, 2026, 2027, 2028. How much will one Bank of America share be worth in 2024 - 2028?
When should I take profit in Bank of America stock? When should I record a loss on Bank of America stock? What are analysts' forecasts for Bank of America stock? What is the future of Bank of America stock? We forecast Bank of America stock performance using neural networks based on historical data on Bank of America stocks. Also, when forecasting, technical analysis tools are used, world geopolitical and news factors are taken into account.
Bank of America stock prediction results are shown below and presented in the form of graphs, tables and text information, divided into time intervals. (Next month, 2024, 2025, 2026, 2027 and 2028) The final quotes of the instrument at the close of the previous trading day are a signal to adjust the forecasts for Bank of America shares. This happens once a day.
Historical and forecast chart of Bank of America stock
The chart below shows the historical price of Bank of America stock and a prediction chart for the next month. For convenience, prices are divided by color. Forecast prices include: Optimistic Forecast, Pessimistic Forecast, and Weighted Average Best Forecast. Detailed values for the Bank of America stock price can be found in the table below.
Long-term forecasts by years.


Forecasting Bank of America (BAC) stocks requires a nuanced understanding of several critical factors that will influence its rate in the near future. Analysts must keenly observe changes in these key areas to predict BAC's stock trajectory accurately.
Critical Influences on BAC Stock Rates
The Federal Reserve's interest rate policies are paramount. Anticipated interest rate cuts can compress net interest margins (NIM), affecting BAC's profitability and stock value. Analysts anticipate floating rate preferred shares' dividends to decline, making fixed-rate options more appealing.
Another vital factor is loan performance and loan loss provisions. BAC has seen a disturbing rise in net charge-offs, from $869 million to over $1.5 billion in one year, surpassing its loan loss provisions. Poor management in this area could undermine investor confidence and dent stock value.
Deposit flows also play a significant role. A recent 2% drop in deposits challenges BAC's ability to fund loans internally, potentially leading to higher costs if external financing is needed. This shift can impact BAC's net interest income and stock price.
While net interest income trends have remained above pre-pandemic levels, a slight decline signals potential pressures. Sustained interest income is essential for profitability, and further declines could negatively impact stock valuation.
Lastly, the perception of a government backstop offers some stability but isn't sufficient to counter fundamental weaknesses. Investors bear this in mind but focus more on intrinsic financial health.
- Interest Rate Movements: Critical for NIM and overall profitability.
- Loan Performance and Provisions: Essential for managing investor confidence and stock stability.
- Deposit Flows: Impact cost-effective internal funding mechanisms.
- Net Interest Income: Indicator of earning potential and stock health.
- Government Backstop: Provides stability but cannot replace strong financials.
By monitoring these factors, analysts can better predict BAC stock movements, helping investors decide whether to buy or sell Bank of America stock. The insightful analysis of these elements forms the basis of a robust BAC stock forecast and aids in precise BAC stock price predictions.
Review the original Analysis

Forecasting BAC Stock Rates: Key Factors Driving Future Performance

The near future presents several pivotal factors that will significantly influence Bank of America's (BAC) stock rates. One major component is the Net Interest Income (NII) forecast, with BAC projecting an impressive $600 million increase by year-end. This robust NII forecast underscores steady profitability, regardless of anticipated interest rate cuts in 2024, providing a major boost to investor confidence and potentially elevating stock prices.
Inflation and Interest Rates: Impact and Strategy
Another critical factor is inflation trends. Recently, inflation has dropped to 3%, which bodes well for consumer spending and borrowing, essential for BAC's business. Receding inflation also signals potential interest rate cuts. However, BAC’s optimistic NII forecast indicates resilience to lower rates, ensuring profitability even in a lower-rate environment.
Book value growth further strengthens BAC's position, with a consistent 2% increase in 2Q24. Currently trading at a 25% premium to book value, BAC is considered undervalued compared to peers like JPMorgan, which trades at an 88% premium. This relative undervaluation may drive investment flows into BAC as investors seek attractive opportunities.
- Net Interest Income (NII) Forecast: $600 million increase by year-end, indicating robust profitability.
- Book Value Growth: Consistent 2% increase in 2Q24, highlighting financial health.
- Inflation Trends: Falling inflation rates support economic stability.
- Interest Rate Expectations: Balanced outlook with resilient NII, reassuring investors.
Analysts can leverage these factors to predict BAC stock price changes accurately. Monitoring NII forecasts, book value growth trends, inflation rates, and interest rate expectations enables precise stock price predictions, making BAC an attractive investment.
Review the original Analysis

Key Factors Impacting BAC Stock Price Forecasts: What Investors Need to Know

Bank of America (BAC) has demonstrated intriguing dynamics affecting its stock price. The most significant events and factors poised to influence BAC stock in the near future include the growth in investment banking fees, a decline in net interest income, and changes in loan loss provisions and charge-offs. Analysts should keep a close watch on these elements when forecasting BAC's stock rates.
Major Influencers on BAC Stock Rates
The 29% year-over-year increase in investment banking fees is a critical driver of Bank of America's stock performance. This growth contributes 17.3% of the net income for Q2, making it a vital revenue stream. Sustained or accelerated growth in this sector will likely boost BAC stock price, as it enhances overall profitability and bolsters investor confidence.
Meanwhile, the 3% decline in net interest income, which remains the largest component of BAC’s earnings, presents a downside risk. Persistent low-interest rates exacerbate this issue, potentially making BAC less attractive compared to peers with stronger interest income. Analysts should consider this factor when making BAC stock price predictions.
Further, the $1.1 billion addition to loan loss provisions and the doubling of charge-offs signal increasing caution against potential defaults. This may indicate underlying credit risks that could impact profitability. While it’s a precautionary measure, it could lead to hesitancy among investors.
BAC's strong liquidity position, with highly liquid assets making up 56% of deposits, positions it favorably against unexpected financial disturbances. This factor supports stability, mitigating downside risk during economic uncertainty, an essential consideration for those predicting BAC stock price targets.
- **Investment Banking Fees Growth:** Indicates strong revenue potential and investor confidence.
- **Net Interest Income Decline:** Monitoring this can flag potential profitability issues.
- **Provision for Loan Losses and Charge-offs:** Signify credit risk management essential for assessing future stock performance.
- **Liquidity Position:** Provides a buffer against economic disruptions, enabling better crisis navigation.
- **Market Valuation Relative to Sector:** Analysts should evaluate if BAC's premium valuation is justified by growth.
In summary, by closely analyzing these key factors, analysts can craft more accurate and strategic BAC stock price predictions, guiding investors on whether BAC stock is a good buy or sell.
Review the original Analysis
- Bank of America successfully adapted its business model by using some assets from the 2008 Federal Reserve aid package, which are now part of the bank’s subsidiaries.
- Mark-to-market valuations have negligible impacts on its operations as long as it holds on to securities until they mature and assumes constant operations. On the downside, “mark-to-market” symbolizes an opportunity cost that companies need to embrace for assured future gains.
- The bank principally focuses on managing incoming and outgoing cash flows to yield profits. It doesn’t excessively worry about unpredictable market conditions.
BAC is set to make significant financial gains as the ill-conceived, held-to-maturity securities that have been generating losses eventually roll off. The stock right now upgrades to a ‘Buy’ rating with an anticipated 7%-9% annual return over the long haul.
The stock has been performing admirably, even outpacing both the broader S&P 500 (SPY) and the illustrious “Magnificent 7”.
So what’s fueling these returns?
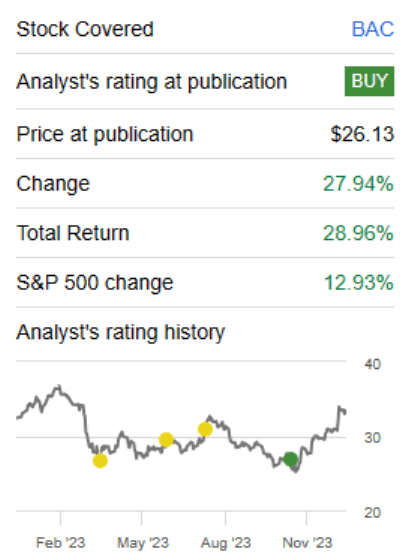
A whopping 29% total return over three months might lead you to believe that BAC has either reinvented some financial mechanism or tapped into the lucrative AI market. But far from it. The reality is that earnings estimates have seen a reluctant dip in the past month.
What’s really driving this is essentially market risk for a harsh recession being priced out. There are plenty of metrics you could consider for this, but Baa corporate bond yields (that teeter on investment-grade) and their spreads to US Treasuries have served as a terrific reverse indicator for BAC stock.
Given that yield is nearing its year-long low, you’d need to start questioning your future predictions for this and other risk factors.
About the Company
Bank of America is an international corporation operating in 35 countries. The company has 213,000 employees, 16,000 ATMs and 4,700 offices across America. It is engaged in three areas: lending to individuals and servicing their accounts; helping corporations manage assets; and trading on currency, stock, and commodity exchanges.
In 2015, Forbes ranked Bank of America as the twenty-third largest company in the world. In 2016, the bank became the largest in the United States in terms of assets. In 2016, the company earned $ 83.7 billion.
The company has been around since 1904, when Amadeo Giannini founded the Bank of Italy in San Francisco. Bank Giannini was different from other banks of the early 20th century: it had 100 branches, which served the middle class and immigrants – other banks in the city did not give them loans. After the 1906 earthquake, the Bank of Italy retained its building and money, unlike other banks. Giannini took advantage of the saved resources and began issuing recovery loans a few days after the disaster. In 1929 Bank of Italy merged with Los Angeles-based Bank of America. The United Bank received the name of the latter.
Bank of America daily forecast for a month
| Date | Target | Pes. | Opt. | Vol., % |
|---|---|---|---|---|
| Jul 29 | 41.14 | 40.45 | 41.95 | 3.69 |
| Jul 30 | 41.23 | 40.56 | 41.53 | 2.38 |
| Jul 31 | 41.61 | 40.62 | 42.21 | 3.93 |
| Aug 01 | 41.49 | 41.20 | 41.87 | 1.63 |
| Aug 02 | 41.35 | 40.82 | 41.75 | 2.28 |
| Aug 03 | 41.56 | 40.58 | 42.31 | 4.27 |
| Aug 04 | 41.04 | 40.39 | 41.38 | 2.47 |
| Aug 05 | 41.04 | 40.68 | 41.91 | 3.03 |
| Aug 06 | 39.89 | 39.10 | 40.72 | 4.13 |
| Aug 07 | 40.29 | 40.02 | 40.94 | 2.30 |
| Aug 08 | 40.62 | 39.87 | 40.90 | 2.57 |
| Aug 09 | 40.04 | 39.11 | 40.43 | 3.38 |
| Aug 10 | 39.49 | 38.70 | 40.44 | 4.50 |
| Aug 11 | 39.76 | 38.98 | 40.47 | 3.83 |
| Aug 12 | 40.25 | 39.93 | 40.72 | 2.00 |
| Aug 13 | 40.80 | 40.20 | 41.46 | 3.14 |
| Aug 14 | 40.18 | 39.44 | 40.74 | 3.30 |
| Aug 15 | 39.95 | 39.67 | 40.79 | 2.84 |
| Aug 16 | 39.12 | 38.74 | 39.67 | 2.39 |
| Aug 17 | 38.07 | 37.61 | 38.37 | 2.00 |
| Aug 18 | 38.01 | 37.73 | 38.86 | 2.99 |
| Aug 19 | 37.08 | 36.61 | 37.69 | 2.95 |
| Aug 20 | 36.80 | 35.93 | 37.54 | 4.49 |
| Aug 21 | 37.12 | 36.32 | 37.55 | 3.40 |
| Aug 22 | 37.34 | 36.74 | 38.16 | 3.87 |
| Aug 23 | 38.33 | 37.52 | 39.03 | 4.01 |
| Aug 24 | 37.72 | 36.95 | 38.60 | 4.47 |
| Aug 25 | 37.15 | 36.53 | 37.56 | 2.81 |
| Aug 26 | 36.21 | 35.85 | 36.59 | 2.06 |
| Aug 27 | 35.14 | 34.73 | 35.45 | 2.06 |
Bank of America Daily Price Targets
Bank of America Stock Forecast 07-29-2024.
Forecast target price for 07-29-2024: $41.14.
Negative dynamics for Bank of America shares will prevail with possible volatility of 3.561%.
Pessimistic target level: 40.45
Optimistic target level: 41.95
Bank of America Stock Forecast 07-30-2024.
Forecast target price for 07-30-2024: $41.23.
Positive dynamics for Bank of America shares will prevail with possible volatility of 2.323%.
Pessimistic target level: 40.56
Optimistic target level: 41.53
Bank of America Stock Forecast 07-31-2024.
Forecast target price for 07-31-2024: $41.61.
Positive dynamics for Bank of America shares will prevail with possible volatility of 3.786%.
Pessimistic target level: 40.62
Optimistic target level: 42.21
Bank of America Stock Forecast 08-01-2024.
Forecast target price for 08-01-2024: $41.49.
Negative dynamics for Bank of America shares will prevail with possible volatility of 1.605%.
Pessimistic target level: 41.20
Optimistic target level: 41.87
Bank of America Stock Forecast 08-02-2024.
Forecast target price for 08-02-2024: $41.35.
Negative dynamics for Bank of America shares will prevail with possible volatility of 2.229%.
Pessimistic target level: 40.82
Optimistic target level: 41.75
Bank of America Stock Forecast 08-03-2024.
Forecast target price for 08-03-2024: $41.56.
Positive dynamics for Bank of America shares will prevail with possible volatility of 4.096%.
Pessimistic target level: 40.58
Optimistic target level: 42.31
BAC (BAC) Monthly Stock Prediction for 2024
| Month | Target | Pes. | Opt. | Vol., % |
|---|---|---|---|---|
| Aug. | 42.43 | 41.69 | 43.44 | 4.03 |
| Sep. | 44.63 | 42.35 | 45.66 | 7.25 |
| Oct. | 43.35 | 42.16 | 44.41 | 5.06 |
| Nov. | 44.35 | 43.60 | 45.99 | 5.20 |
| Dec. | 45.43 | 43.40 | 46.93 | 7.52 |
Bank of America forecast for this year
Bank of America Stock Prediction for Aug 2024
An uptrend is forecast for this month with an optimal target price of $42.4284. Pessimistic: $41.69. Optimistic: $43.44
Bank of America Stock Prediction for Sep 2024
An uptrend is forecast for this month with an optimal target price of $44.6262. Pessimistic: $42.35. Optimistic: $45.66
Bank of America Stock Prediction for Oct 2024
An downtrend is forecast for this month with an optimal target price of $43.3454. Pessimistic: $42.16. Optimistic: $44.41
Bank of America Stock Prediction for Nov 2024
An uptrend is forecast for this month with an optimal target price of $44.3467. Pessimistic: $43.60. Optimistic: $45.99
Bank of America Stock Prediction for Dec 2024
An uptrend is forecast for this month with an optimal target price of $45.4332. Pessimistic: $43.40. Optimistic: $46.93
Bank of America (BAC) Monthly Stock Prediction for 2025
| Month | Target | Pes. | Opt. | Vol., % |
|---|---|---|---|---|
| Jan | 45.27 | 44.26 | 46.29 | 4.38 |
| Feb | 46.61 | 44.13 | 48.14 | 8.34 |
| Mar | 45.63 | 44.60 | 47.13 | 5.35 |
| Apr | 45.28 | 44.29 | 46.57 | 4.90 |
| May | 46.80 | 44.67 | 49.09 | 9.01 |
| Jun | 46.96 | 45.28 | 49.36 | 8.26 |
| Jul | 48.44 | 46.71 | 50.41 | 7.33 |
| Aug | 47.46 | 46.76 | 48.82 | 4.22 |
| Sep | 48.78 | 48.07 | 49.95 | 3.76 |
| Oct | 51.35 | 49.91 | 53.43 | 6.59 |
| Nov | 54.80 | 52.65 | 57.33 | 8.16 |
| Dec | 55.49 | 54.44 | 57.47 | 5.27 |
Bank of America (BAC) Monthly Stock Prediction for 2026
| Month | Target | Pes. | Opt. | Vol., % |
|---|---|---|---|---|
| Jan | 56.23 | 55.44 | 59.10 | 6.19 |
| Feb | 56.58 | 55.35 | 57.37 | 3.52 |
| Mar | 52.78 | 50.89 | 54.44 | 6.51 |
| Apr | 52.04 | 50.36 | 54.88 | 8.23 |
| May | 51.42 | 48.72 | 54.12 | 9.98 |
| Jun | 52.25 | 50.16 | 54.70 | 8.29 |
| Jul | 54.33 | 51.78 | 55.93 | 7.41 |
| Aug | 53.57 | 50.91 | 55.93 | 8.98 |
| Sep | 57.32 | 55.64 | 58.60 | 5.07 |
| Oct | 59.65 | 57.23 | 61.32 | 6.67 |
| Nov | 55.76 | 53.03 | 57.72 | 8.12 |
| Dec | 54.95 | 53.45 | 55.87 | 4.34 |
Bank of America (BAC) Monthly Stock Prediction for 2027
| Month | Target | Pes. | Opt. | Vol., % |
|---|---|---|---|---|
| Jan | 53.06 | 51.05 | 55.33 | 7.72 |
| Feb | 52.58 | 50.63 | 53.57 | 5.50 |
| Mar | 51.80 | 49.96 | 54.42 | 8.20 |
| Apr | 52.97 | 50.15 | 55.04 | 8.89 |
| May | 56.23 | 54.97 | 58.67 | 6.31 |
| Jun | 58.98 | 57.50 | 60.59 | 5.11 |
| Jul | 58.61 | 55.62 | 60.66 | 8.32 |
| Aug | 59.88 | 58.71 | 62.44 | 5.97 |
| Sep | 60.13 | 57.99 | 61.90 | 6.32 |
| Oct | 59.92 | 58.08 | 60.76 | 4.42 |
| Nov | 57.99 | 54.91 | 59.50 | 7.71 |
| Dec | 54.02 | 52.88 | 55.76 | 5.15 |
Bank of America (BAC) Monthly Stock Prediction for 2028
| Month | Target | Pes. | Opt. | Vol., % |
|---|---|---|---|---|
| Jan | 52.69 | 50.37 | 54.94 | 8.32 |
| Feb | 51.22 | 49.60 | 53.40 | 7.12 |
| Mar | 50.00 | 49.23 | 51.54 | 4.48 |
| Apr | 48.46 | 45.74 | 50.97 | 10.25 |
| May | 51.24 | 48.69 | 53.82 | 9.53 |
| Jun | 53.14 | 51.88 | 56.12 | 7.56 |
| Jul | 53.66 | 51.37 | 56.67 | 9.35 |
| Aug | 54.19 | 53.05 | 55.93 | 5.15 |
| Sep | 56.39 | 54.34 | 57.22 | 5.04 |
| Oct | 55.52 | 54.24 | 57.85 | 6.25 |
| Nov | 56.80 | 54.10 | 58.75 | 7.92 |
| Dec | 56.32 | 53.37 | 58.02 | 8.02 |
Bank of America information and performance
BANK OF AMERICA CORPORATE CENTER, 100 N TRYON ST, CHARLOTTE, NC, US
Market capitalization of the Bank of America Corp. is the total market value of all issued shares of a company. It is calculated by the formula multiplying the number of BAC shares in the company outstanding by the market price of one share.
EBITDA of Bank of America is earnings before interest, income tax and depreciation of assets.
P/E ratio (price to earnings) - shows the ratio between the price of a share and the company's profit
Price/earnings to growth
Dividend Per Share is a financial indicator equal to the ratio of the company's net profit available for distribution to the annual average of ordinary shares.
Dividend yield is a ratio that shows how much a company pays in dividends each year at the stock price.
EPS shows how much of the net profit is accounted for by the common share.
Trailing P/E depends on what has already been done. It uses the current share price and divides it by the total earnings per share for the last 12 months.
Forward P/E uses projections of future earnings instead of final numbers.
Enterprise Value (EV) /Revenue
The EV / EBITDA ratio shows the ratio of the cost (EV) to its profit before tax, interest and amortization (EBITDA).
Number of issued ordinary shares
Number of freely tradable shares
Shares Short Prior Month - the number of shares in short positions in the last month.
Bank of America (BAC) stock dividend
Bank of America last paid dividends on 09/06/2024. The next scheduled payment will be on 06/28/2024. The amount of dividends is $0.96 per share. If the date of the next dividend payment has not been updated, it means that the issuer has not yet announced the exact payment. As soon as information becomes available, we will immediately update the data. Bookmark our portal to stay updated.
Last Split Date: 01/01/1970
Splitting of shares is an increase in the number of securities of the issuing company circulating on the market due to a decrease in their value at constant capitalization.
For example, a 5: 1 ratio means that the value of one share will decrease 5 times, the total amount will increase 5 times. It is important to understand that this procedure does not change the capitalization of the company, as well as the total value of assets held in private hands.


