


April 27, 2024 Alphabet and Microsoft’s AI Investments Yield Strong Returns
April 26, 2024 Top 10 High Dividend Yield Stocks

Tesla Q1: Model 2 Could Be Their Model T


Tesla Is An AI Company That The Market Won’t Reward For Now

Amazon: The Margin Train Is Gaining Speed

April 23, 2024 Maximizing Profits: When is the Right Time to Sell Your Business?

April 12, 2024 Improve Your Financial Status: A How-To Guide
April 12, 2024 How ZIM Integrated Container Tracking is Revolutionizing Global Trade

March 15, 2024 6 Best Growth Stocks To Buy Now According to Metatrader 5

Transocean (RIG) Stock Forecast for 2024–2028. Sell or Buy?
Updated: April 27, 2024 (15:59)
Sector: EnergyThe share price of Transocean Ltd. (RIG) now
50/200 Day Moving Average: $5.62 / $6.74
This figure corresponds to the Average Price over the previous 50/200 days. For Transocean stocks, the 50-day moving average is the support level today.
For Transocean stocks, the 200-day moving average is the resistance level today.
Are you interested in Transocean Ltd. stocks and want to buy them, or are they already in your portfolio? If yes, then on this page you will find useful information about the dynamics of the Transocean stock price in 2024, 2025, 2026, 2027, 2028. How much will one Transocean share be worth in 2024 - 2028?
When should I take profit in Transocean stock? When should I record a loss on Transocean stock? What are analysts' forecasts for Transocean stock? What is the future of Transocean stock? We forecast Transocean stock performance using neural networks based on historical data on Transocean stocks. Also, when forecasting, technical analysis tools are used, world geopolitical and news factors are taken into account.
Transocean stock prediction results are shown below and presented in the form of graphs, tables and text information, divided into time intervals. (Next month, 2024, 2025, 2026, 2027 and 2028) The final quotes of the instrument at the close of the previous trading day are a signal to adjust the forecasts for Transocean shares. This happens once a day.
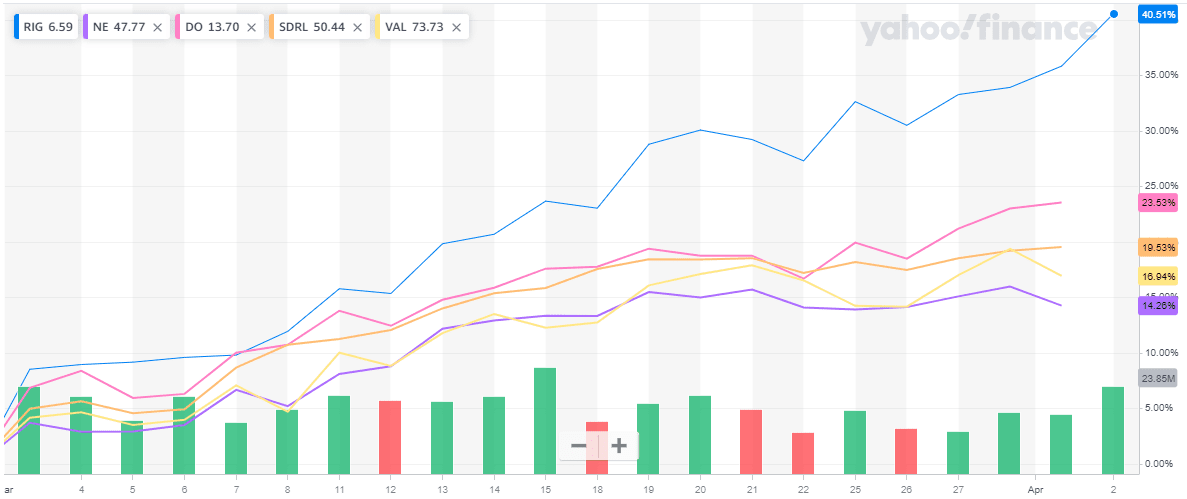
Historical and forecast chart of Transocean stock
The chart below shows the historical price of Transocean stock and a prediction chart for the next month. For convenience, prices are divided by color. Forecast prices include: Optimistic Forecast, Pessimistic Forecast, and Weighted Average Best Forecast. Detailed values for the Transocean stock price can be found in the table below.
Long-term forecasts by years.
Unlocking the Future of RIG Stocks: A Look at Key Influencers

In an ever-evolving energy market, Transocean's stock forecast (RIG) is a subject of intense scrutiny and speculation among investors. As we delve into what the near future holds for RIG stocks, there are pivotal factors and recent events that stand out as potential game-changers. Recognizing these can significantly aid analysts in making the most accurate RIG stock price prediction.
Deciphering Future Moves in RIG Stock Values
Firstly, the recent extension of the Deepwater Asgard drillship contract highlights a robust demand for high-specification assets. This extension not only underscores Transocean's capability to secure profitable engagements but also serves as a strong indicator that RIG stock is a good buy. Analysts would do well to factor in the implications of such contract dynamics when forecasting the RIG stock price target.
Moreover, the strengthening of oil prices and market sentiment plays a crucial role. A positive swing in these could further buoy investors' confidence, making RIG a more attractive investment. Thus, closely tracking oil market trends is essential for any RIG stock forecast.
Lastly, addressing the issues of idle time and cold-stacked assets is critical. Success in reactivating these resources and securing long-term contracts could significantly impact Transocean’s financial health and, by extension, the RIG stock buy or sell decision.
By weaving these factors together, an analyst can craft a more nuanced and accurate Transocean stock forecast, offering investors insights on whether to buy or sell Transocean stock. As we move forward, keeping a close watch on these key indicators will be paramount in navigating the shifts in RIG's stock rates.
Review the original Analysis

Is RIG Stock Poised for a Surge? Unpacking the Forecast
Rising to the challenge of predicting stock market dynamics, particularly for an entity like Transocean (RIG), requires a deep dive into various critical factors that shape its financial landscape. Among the myriad aspects influencing RIG stock forecasts, some stand out for their potential impact in the near future.
First and foremost, the average daily revenue per rig promises a pivotal role owing to increasing demand for drilling rigs. This surge is anticipated to spark notable growth in revenue, potentially elevating RIG stock prices. Secondly, a close eye on the backlog figures could provide invaluable insights. With a healthy backlog indicating a robust pipeline of contracted work, analysts can forecast future revenue streams, which could prove a boon for RIG stock forecasts. However, the fluctuating state of cash flows, contrasted against a backdrop of growing revenue yet heightened operating costs, is a red flag warranting attention.
Deciphering the Code: Analysts’ Toolbox
Analysts aiming to sculpt the most accurate RIG stock price predictions should weigh these factors meticulously. The stability of net debt and fleet utilization rates serve as additional pieces of this complex puzzle. While debt stabilization might offset some concerns, the stagnation in fleet utilization rates reflects underlying demand issues that could dampen stock value. Moreover, broader industry dynamics, including the oscillations in non-conventional oil production and OPEC+ decisions, could significantly sway the attractiveness of offshore drilling investments, impacting stock predictions.
- Average daily revenue per rig
- Backlog
- Debt stabilization
- Cash flow trends
- Fleet utilization rates
- Industry dynamics
Considering these factors holistically, whether RIG is a good stock to buy, hold, or sell becomes clearer. While the picture of RIG's stock price target brightens with positive data in revenue and backlog, the uncertainties surrounding cash flow and fleet utilization rates serve as cautionary tales. Hence, investors pondering over "buy or sell Transocean stock" queries need to stay attuned to these indicators for making informed decisions regarding their investment in RIG stocks.
Review the original Analysis

Navigating the Rough Seas: Predicting Transocean Stock Movements
In the ever-turbulent waters of the stock market, the fate of Transocean's (RIG) shares is swayed by a combination of critical factors. Analysts peering into the company's future are particularly keyed into several events and dynamics that stand to significantly influence RIG stock rates in the near term. Among these, contract startup delays top the list, as these hiccups in initiating new projects can dampen financial performances, sending ripples of concern among investors. Furthermore, the decision by TotalEnergies to abstain from exercising options, after halting its drilling campaign offshore Lebanon, speaks volumes about customer confidence, thereby affecting future revenue streams.
Using Predictive Factors to Chart Course
Additionally, the operational parameters of rigs like the Deepwater Atlas, which is tethered to a low-margin dayrate in Q1 due to the customer's current indifference to its advanced 20,000 Psi drilling capability, cast shadows on profitability. Lastly, the sale of valuable assets such as the moored semi-submersible rigs—Paul B Loyd Jr. and Transocean Leader—to Dolphin Drilling forfeits potential revenue, further challenging financial forecasts.
To navigate these turbulent waters, analysts must weigh these factors judiciously. By understanding how contract startup delays, customer decisions like those made by TotalEnergies, low-margin dayrates, and the sale of significant assets influence RIG's operational and financial landscape, analysts can fine-tune their predictions. A comprehensive analysis, considering these aspects in their order of impact—starting with contract delays to the sale of rigs—enables in crafting a well-informed forecast of Transocean's stock trajectories.
- Contract startup delays
- TotalEnergies' decision and customer confidence
- Sale of key assets and its impact on revenue
- Profitability concerns due to low-margin dayrates
By closely monitoring and evaluating these pivotal factors, investors and analysts alike can steer through the choppy market with greater confidence in their forecasts for RIG's stock performance.
Review the original Analysis
Transocean Ltd. together with its subsidiaries provides contract drilling services for oil and gas wells around the world. It contracts with its drilling rigs, related equipment and work crews to drill oil and gas wells. As of February 22, 2021, the company owned or partially owned and operated a fleet of 37 mobile offshore drilling rigs, including 27 ultra-deepwater and 10 harsh environment floating vessels.
Transocean daily forecast for a month
| Date | Target | Pes. | Opt. | Vol., % |
|---|---|---|---|---|
| Apr 29 | 5.77 | 5.63 | 5.99 | 6.45 |
| Apr 30 | 5.72 | 5.49 | 5.84 | 6.35 |
| May 01 | 5.62 | 5.40 | 5.75 | 6.40 |
| May 02 | 5.34 | 5.14 | 5.49 | 6.81 |
| May 03 | 5.55 | 5.41 | 5.76 | 6.46 |
| May 04 | 5.66 | 5.59 | 5.84 | 4.35 |
| May 05 | 5.74 | 5.52 | 5.86 | 6.07 |
| May 06 | 5.86 | 5.80 | 5.97 | 2.98 |
| May 07 | 6.07 | 5.84 | 6.18 | 5.77 |
| May 08 | 5.82 | 5.65 | 5.95 | 5.15 |
| May 09 | 5.62 | 5.45 | 5.68 | 4.23 |
| May 10 | 5.55 | 5.41 | 5.63 | 4.05 |
| May 11 | 5.58 | 5.41 | 5.75 | 6.30 |
| May 12 | 5.46 | 5.38 | 5.55 | 3.19 |
| May 13 | 5.36 | 5.20 | 5.43 | 4.49 |
| May 14 | 5.50 | 5.36 | 5.60 | 4.57 |
| May 15 | 5.57 | 5.39 | 5.76 | 7.03 |
| May 16 | 5.83 | 5.60 | 6.04 | 7.80 |
| May 17 | 5.89 | 5.66 | 6.04 | 6.77 |
| May 18 | 6.03 | 5.86 | 6.25 | 6.68 |
| May 19 | 6.09 | 6.02 | 6.17 | 2.48 |
| May 20 | 5.84 | 5.61 | 5.99 | 6.92 |
| May 21 | 5.83 | 5.69 | 6.00 | 5.43 |
| May 22 | 5.75 | 5.65 | 5.92 | 4.68 |
| May 23 | 5.93 | 5.82 | 6.08 | 4.58 |
| May 24 | 6.05 | 5.82 | 6.14 | 5.46 |
| May 25 | 6.00 | 5.77 | 6.23 | 8.01 |
| May 26 | 6.12 | 5.91 | 6.29 | 6.48 |
| May 27 | 6.01 | 5.90 | 6.11 | 3.46 |
| May 28 | 5.81 | 5.68 | 5.97 | 5.12 |
Transocean Daily Price Targets
Transocean Stock Forecast 04-29-2024.
Forecast target price for 04-29-2024: $5.77.
Negative dynamics for Transocean shares will prevail with possible volatility of 6.061%.
Pessimistic target level: 5.63
Optimistic target level: 5.99
Transocean Stock Forecast 04-30-2024.
Forecast target price for 04-30-2024: $5.72.
Negative dynamics for Transocean shares will prevail with possible volatility of 5.969%.
Pessimistic target level: 5.49
Optimistic target level: 5.84
Transocean Stock Forecast 05-01-2024.
Forecast target price for 05-01-2024: $5.62.
Negative dynamics for Transocean shares will prevail with possible volatility of 6.015%.
Pessimistic target level: 5.40
Optimistic target level: 5.75
Transocean Stock Forecast 05-02-2024.
Forecast target price for 05-02-2024: $5.34.
Negative dynamics for Transocean shares will prevail with possible volatility of 6.378%.
Pessimistic target level: 5.14
Optimistic target level: 5.49
Transocean Stock Forecast 05-03-2024.
Forecast target price for 05-03-2024: $5.55.
Positive dynamics for Transocean shares will prevail with possible volatility of 6.066%.
Pessimistic target level: 5.41
Optimistic target level: 5.76
Transocean Stock Forecast 05-04-2024.
Forecast target price for 05-04-2024: $5.66.
Positive dynamics for Transocean shares will prevail with possible volatility of 4.167%.
Pessimistic target level: 5.59
Optimistic target level: 5.84
RIG (RIG) Monthly Stock Prediction for 2024
| Month | Target | Pes. | Opt. | Vol., % |
|---|---|---|---|---|
| May. | 6.87 | 6.57 | 7.25 | 9.47 |
| Jun. | 7.09 | 6.08 | 7.90 | 22.98 |
| Jul. | 6.93 | 6.45 | 8.01 | 19.55 |
| Aug. | 5.81 | 5.52 | 6.19 | 10.88 |
| Sep. | 5.59 | 4.85 | 5.87 | 17.33 |
| Oct. | 6.62 | 6.27 | 7.11 | 11.73 |
| Nov. | 7.53 | 6.57 | 8.13 | 19.26 |
| Dec. | 7.06 | 6.40 | 7.92 | 19.25 |
Transocean forecast for this year
Transocean Stock Prediction for May 2024
An uptrend is forecast for this month with an optimal target price of $6.86742. Pessimistic: $6.57. Optimistic: $7.25
Transocean Stock Prediction for Jun 2024
An uptrend is forecast for this month with an optimal target price of $7.08718. Pessimistic: $6.08. Optimistic: $7.90
Transocean Stock Prediction for Jul 2024
An downtrend is forecast for this month with an optimal target price of $6.93126. Pessimistic: $6.45. Optimistic: $8.01
Transocean Stock Prediction for Aug 2024
An downtrend is forecast for this month with an optimal target price of $5.8084. Pessimistic: $5.52. Optimistic: $6.19
Transocean Stock Prediction for Sep 2024
An downtrend is forecast for this month with an optimal target price of $5.58768. Pessimistic: $4.85. Optimistic: $5.87
Transocean Stock Prediction for Oct 2024
An uptrend is forecast for this month with an optimal target price of $6.61581. Pessimistic: $6.27. Optimistic: $7.11
Transocean Stock Prediction for Nov 2024
An uptrend is forecast for this month with an optimal target price of $7.52879. Pessimistic: $6.57. Optimistic: $8.13
Transocean Stock Prediction for Dec 2024
An downtrend is forecast for this month with an optimal target price of $7.06201. Pessimistic: $6.40. Optimistic: $7.92
Transocean (RIG) Monthly Stock Prediction for 2025
| Month | Target | Pes. | Opt. | Vol., % |
|---|---|---|---|---|
| Jan | 7.75 | 6.56 | 8.79 | 25.40 |
| Feb | 6.64 | 5.69 | 7.54 | 24.47 |
| Mar | 6.43 | 5.62 | 7.41 | 24.26 |
| Apr | 6.63 | 5.65 | 7.57 | 25.39 |
| May | 7.80 | 7.03 | 8.90 | 21.02 |
| Jun | 8.27 | 7.03 | 8.78 | 19.96 |
| Jul | 9.01 | 8.54 | 10.27 | 16.84 |
| Aug | 8.45 | 7.22 | 9.21 | 21.65 |
| Sep | 8.10 | 6.93 | 9.05 | 23.43 |
| Oct | 9.05 | 7.89 | 10.19 | 22.56 |
| Nov | 9.36 | 8.65 | 10.78 | 19.79 |
| Dec | 10.26 | 8.78 | 11.30 | 22.32 |
Transocean (RIG) Monthly Stock Prediction for 2026
| Month | Target | Pes. | Opt. | Vol., % |
|---|---|---|---|---|
| Jan | 11.04 | 9.49 | 12.54 | 24.30 |
| Feb | 11.39 | 9.61 | 12.19 | 21.12 |
| Mar | 10.39 | 9.97 | 12.03 | 17.10 |
| Apr | 10.76 | 9.84 | 12.35 | 20.38 |
| May | 12.44 | 11.15 | 14.26 | 21.81 |
| Jun | 14.61 | 13.79 | 16.36 | 15.71 |
| Jul | 14.28 | 13.20 | 15.11 | 12.67 |
| Aug | 12.03 | 10.82 | 13.59 | 20.35 |
| Sep | 10.68 | 9.61 | 11.73 | 18.03 |
| Oct | 11.15 | 9.57 | 12.29 | 22.14 |
| Nov | 10.79 | 9.45 | 11.96 | 20.94 |
| Dec | 10.56 | 9.90 | 11.51 | 13.94 |
Transocean (RIG) Monthly Stock Prediction for 2027
| Month | Target | Pes. | Opt. | Vol., % |
|---|---|---|---|---|
| Jan | 10.70 | 9.31 | 11.45 | 18.69 |
| Feb | 12.35 | 11.49 | 13.91 | 17.41 |
| Mar | 12.40 | 11.91 | 13.34 | 10.78 |
| Apr | 13.39 | 12.56 | 14.30 | 12.17 |
| May | 14.92 | 14.14 | 16.53 | 14.44 |
| Jun | 16.74 | 15.30 | 18.25 | 16.15 |
| Jul | 18.38 | 16.07 | 19.45 | 17.39 |
| Aug | 17.54 | 14.73 | 20.34 | 27.59 |
| Sep | 18.13 | 16.50 | 19.33 | 14.63 |
| Oct | 18.68 | 16.55 | 19.46 | 14.97 |
| Nov | 19.09 | 18.21 | 21.11 | 13.74 |
| Dec | 19.51 | 17.17 | 22.32 | 23.08 |
Transocean (RIG) Monthly Stock Prediction for 2028
| Month | Target | Pes. | Opt. | Vol., % |
|---|---|---|---|---|
| Jan | 19.66 | 17.30 | 22.61 | 23.48 |
| Feb | 19.43 | 16.82 | 21.52 | 21.84 |
| Mar | 19.74 | 17.57 | 20.92 | 16.04 |
| Apr | 22.26 | 20.88 | 25.74 | 18.86 |
| May | 26.32 | 22.58 | 29.47 | 23.39 |
| Jun | 29.47 | 28.24 | 33.48 | 15.67 |
| Jul | 30.77 | 29.17 | 34.46 | 15.36 |
| Aug | 27.08 | 24.59 | 29.57 | 16.85 |
| Sep | 25.40 | 22.40 | 29.31 | 23.57 |
| Oct | 24.49 | 21.60 | 26.54 | 18.63 |
| Nov | 22.13 | 19.97 | 25.06 | 20.32 |
| Dec | 22.80 | 20.02 | 24.90 | 19.60 |
Transocean information and performance
TURMSTRASSE 30, STEINHAUSEN, CH
Market capitalization of the Transocean Ltd. is the total market value of all issued shares of a company. It is calculated by the formula multiplying the number of RIG shares in the company outstanding by the market price of one share.
EBITDA of Transocean is earnings before interest, income tax and depreciation of assets.
P/E ratio (price to earnings) - shows the ratio between the price of a share and the company's profit
Price/earnings to growth
Dividend Per Share is a financial indicator equal to the ratio of the company's net profit available for distribution to the annual average of ordinary shares.
Dividend yield is a ratio that shows how much a company pays in dividends each year at the stock price.
EPS shows how much of the net profit is accounted for by the common share.
Trailing P/E depends on what has already been done. It uses the current share price and divides it by the total earnings per share for the last 12 months.
Forward P/E uses projections of future earnings instead of final numbers.
Enterprise Value (EV) /Revenue
The EV / EBITDA ratio shows the ratio of the cost (EV) to its profit before tax, interest and amortization (EBITDA).
Number of issued ordinary shares
Number of freely tradable shares
Shares Short Prior Month - the number of shares in short positions in the last month.
Transocean (RIG) stock dividend
Transocean last paid dividends on 08/21/2015. The next scheduled payment will be on 09/23/2015. The amount of dividends is $None per share. If the date of the next dividend payment has not been updated, it means that the issuer has not yet announced the exact payment. As soon as information becomes available, we will immediately update the data. Bookmark our portal to stay updated.
Last Split Date: 01/01/1970
Splitting of shares is an increase in the number of securities of the issuing company circulating on the market due to a decrease in their value at constant capitalization.
For example, a 5: 1 ratio means that the value of one share will decrease 5 times, the total amount will increase 5 times. It is important to understand that this procedure does not change the capitalization of the company, as well as the total value of assets held in private hands.
Related stocks from Energy sector


