


July 14, 2024 This Week Top S&P 500 Gainers & Losers

Tesla Q2: The Bottom Is Likely In


Tesla: Time To Take Profits

Microsoft: The Q4 Results Should Surprise You

Tesla: Optimus And FSD Probably Won’t Save The Day

April 23, 2024 Maximizing Profits: When is the Right Time to Sell Your Business?

April 12, 2024 Improve Your Financial Status: A How-To Guide
April 12, 2024 How ZIM Integrated Container Tracking is Revolutionizing Global Trade

March 15, 2024 6 Best Growth Stocks To Buy Now According to Metatrader 5

Phillips 66 Partners (PSX) Stock Forecast for 2024–2028. Sell or Buy?
Updated: July 27, 2024 (04:36)
Sector: EnergyThe share price of Phillips 66 Partners LP (PSX) now
50/200 Day Moving Average: $139.65 / $137.71
This figure corresponds to the Average Price over the previous 50/200 days. For Phillips 66 Partners stocks, the 50-day moving average is the support level today.
For Phillips 66 Partners stocks, the 200-day moving average is the support level today.
Are you interested in Phillips 66 Partners LP stocks and want to buy them, or are they already in your portfolio? If yes, then on this page you will find useful information about the dynamics of the Phillips 66 Partners stock price in 2024, 2025, 2026, 2027, 2028. How much will one Phillips 66 Partners share be worth in 2024 - 2028?
When should I take profit in Phillips 66 Partners stock? When should I record a loss on Phillips 66 Partners stock? What are analysts' forecasts for Phillips 66 Partners stock? What is the future of Phillips 66 Partners stock? We forecast Phillips 66 Partners stock performance using neural networks based on historical data on Phillips 66 Partners stocks. Also, when forecasting, technical analysis tools are used, world geopolitical and news factors are taken into account.
Phillips 66 Partners stock prediction results are shown below and presented in the form of graphs, tables and text information, divided into time intervals. (Next month, 2024, 2025, 2026, 2027 and 2028) The final quotes of the instrument at the close of the previous trading day are a signal to adjust the forecasts for Phillips 66 Partners shares. This happens once a day.
Historical and forecast chart of Phillips 66 Partners stock
The chart below shows the historical price of Phillips 66 Partners stock and a prediction chart for the next month. For convenience, prices are divided by color. Forecast prices include: Optimistic Forecast, Pessimistic Forecast, and Weighted Average Best Forecast. Detailed values for the Phillips 66 Partners stock price can be found in the table below.
Long-term forecasts by years.
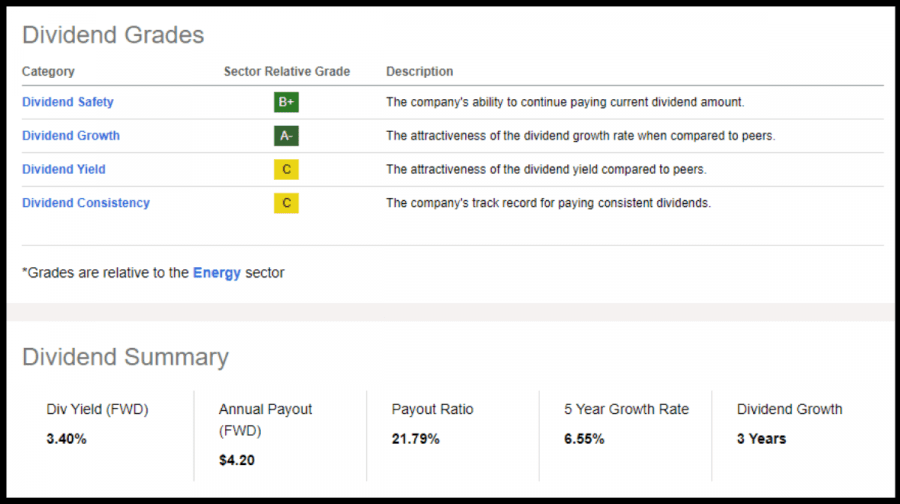
Phillips 66, an impressively diverse independent refiner in the oil and gas industry, boasts firm dividends metrics. These figures suggest a solid three-year growth of dividends and a healthy dividend safety record. Currently nudging towards its 52-week high, it’s soared by +48%, while still going for a bargain compared to the past year. With the forward P/E ratio standing at 7.51x – that’s a 30% contrast to the sector median which is 10.78x. Furthermore, its Price/Sales (FWD) and EV/ Sales differ by more than 75% with the rest of the sector. Such broad numbers might make you wonder why hasn’t everyone jumped on adding this high performer with geographically varied refining portfolios?
Even though market conditions aren’t at their strongest, Phillips 66 stands to win from higher crude prices. The company doesn’t waver from its shareholder commitment, keeping its eyes on cost reduction initiatives and enlarging their midstream segment to skyrocket its EBITDA from $3 billion to an impressive $13 billion come 2025.
In Q2 alone, they returned $1.8 billion through share buybacks and dividends. Going forward, they’ve got clear intentions of giving back between $10 – $12 billion over the period between July 2022 to December 2024.
Although their second-quarter revenue didn’t quite hit projections, Phillips 66 upped their game with EPS reporting at a cool $3.87 billion — that’s a whopping $0.31 more than anticipated! Keeping over $10 billion cash flow from operations gives them a hefty lead within the sector for forecasted EPS Long Term Growth (3-5Y CAGR); hitting at a massive difference of about 310%. This sets them on course as one of the go-to stocks when it comes to dividends.
Throw into the pot an admirable B+ grade for dividend safety and a pleasing five-year growth rate of 6.55%, it even remains thrifty. So, you may want to take a second glance at this energy stock when balancing out your portfolio.
Phillips 66 Partners daily forecast for a month
| Date | Target | Pes. | Opt. | Vol., % |
|---|---|---|---|---|
| Jul 29 | 148.50 | 142.26 | 151.26 | 6.33 |
| Jul 30 | 152.24 | 146.76 | 157.54 | 7.34 |
| Jul 31 | 145.67 | 143.13 | 152.66 | 6.66 |
| Aug 01 | 146.10 | 140.05 | 152.41 | 8.83 |
| Aug 02 | 149.78 | 146.10 | 155.90 | 6.70 |
| Aug 03 | 149.16 | 145.84 | 155.24 | 6.44 |
| Aug 04 | 146.11 | 140.33 | 151.02 | 7.62 |
| Aug 05 | 149.01 | 144.89 | 155.35 | 7.22 |
| Aug 06 | 148.11 | 142.78 | 151.31 | 5.98 |
| Aug 07 | 141.45 | 138.14 | 145.10 | 5.04 |
| Aug 08 | 137.37 | 132.02 | 143.88 | 8.99 |
| Aug 09 | 136.30 | 130.58 | 140.64 | 7.70 |
| Aug 10 | 143.50 | 140.14 | 148.75 | 6.14 |
| Aug 11 | 144.10 | 137.96 | 149.38 | 8.27 |
| Aug 12 | 149.20 | 146.16 | 155.29 | 6.25 |
| Aug 13 | 145.98 | 140.90 | 148.96 | 5.72 |
| Aug 14 | 153.25 | 148.01 | 155.73 | 5.22 |
| Aug 15 | 160.24 | 153.03 | 165.81 | 8.36 |
| Aug 16 | 150.72 | 144.21 | 157.05 | 8.90 |
| Aug 17 | 146.83 | 143.66 | 150.71 | 4.91 |
| Aug 18 | 144.89 | 138.98 | 147.15 | 5.88 |
| Aug 19 | 145.33 | 140.44 | 149.34 | 6.33 |
| Aug 20 | 153.79 | 147.33 | 157.20 | 6.70 |
| Aug 21 | 150.09 | 144.33 | 153.88 | 6.61 |
| Aug 22 | 152.44 | 145.58 | 158.93 | 9.17 |
| Aug 23 | 148.41 | 146.19 | 151.35 | 3.53 |
| Aug 24 | 147.08 | 141.08 | 153.25 | 8.63 |
| Aug 25 | 150.96 | 145.98 | 156.67 | 7.32 |
| Aug 26 | 147.06 | 143.18 | 153.24 | 7.03 |
| Aug 27 | 148.92 | 143.56 | 152.04 | 5.91 |
Phillips 66 Partners Daily Price Targets
Phillips 66 Partners Stock Forecast 07-29-2024.
Forecast target price for 07-29-2024: $148.50.
Positive dynamics for Phillips 66 Partners shares will prevail with possible volatility of 5.949%.
Pessimistic target level: 142.26
Optimistic target level: 151.26
Phillips 66 Partners Stock Forecast 07-30-2024.
Forecast target price for 07-30-2024: $152.24.
Positive dynamics for Phillips 66 Partners shares will prevail with possible volatility of 6.841%.
Pessimistic target level: 146.76
Optimistic target level: 157.54
Phillips 66 Partners Stock Forecast 07-31-2024.
Forecast target price for 07-31-2024: $145.67.
Negative dynamics for Phillips 66 Partners shares will prevail with possible volatility of 6.240%.
Pessimistic target level: 143.13
Optimistic target level: 152.66
Phillips 66 Partners Stock Forecast 08-01-2024.
Forecast target price for 08-01-2024: $146.10.
Positive dynamics for Phillips 66 Partners shares will prevail with possible volatility of 8.109%.
Pessimistic target level: 140.05
Optimistic target level: 152.41
Phillips 66 Partners Stock Forecast 08-02-2024.
Forecast target price for 08-02-2024: $149.78.
Positive dynamics for Phillips 66 Partners shares will prevail with possible volatility of 6.284%.
Pessimistic target level: 146.10
Optimistic target level: 155.90
Phillips 66 Partners Stock Forecast 08-03-2024.
Forecast target price for 08-03-2024: $149.16.
Negative dynamics for Phillips 66 Partners shares will prevail with possible volatility of 6.053%.
Pessimistic target level: 145.84
Optimistic target level: 155.24
PSX (PSX) Monthly Stock Prediction for 2024
| Month | Target | Pes. | Opt. | Vol., % |
|---|---|---|---|---|
| Aug. | 142.11 | 134.86 | 154.90 | 12.94 |
| Sep. | 158.52 | 148.30 | 173.26 | 14.41 |
| Oct. | 167.08 | 157.56 | 183.62 | 14.19 |
| Nov. | 146.53 | 131.58 | 152.69 | 13.82 |
| Dec. | 156.42 | 151.49 | 168.86 | 10.28 |
Phillips 66 Partners forecast for this year
Phillips 66 Partners Stock Prediction for Aug 2024
An downtrend is forecast for this month with an optimal target price of $142.108. Pessimistic: $134.86. Optimistic: $154.90
Phillips 66 Partners Stock Prediction for Sep 2024
An uptrend is forecast for this month with an optimal target price of $158.521. Pessimistic: $148.30. Optimistic: $173.26
Phillips 66 Partners Stock Prediction for Oct 2024
An uptrend is forecast for this month with an optimal target price of $167.081. Pessimistic: $157.56. Optimistic: $183.62
Phillips 66 Partners Stock Prediction for Nov 2024
An downtrend is forecast for this month with an optimal target price of $146.53. Pessimistic: $131.58. Optimistic: $152.69
Phillips 66 Partners Stock Prediction for Dec 2024
An uptrend is forecast for this month with an optimal target price of $156.421. Pessimistic: $151.49. Optimistic: $168.86
Phillips 66 Partners (PSX) Monthly Stock Prediction for 2025
| Month | Target | Pes. | Opt. | Vol., % |
|---|---|---|---|---|
| Jan | 148.44 | 141.10 | 156.46 | 9.82 |
| Feb | 152.90 | 136.84 | 169.41 | 19.22 |
| Mar | 149.46 | 132.20 | 157.53 | 16.08 |
| Apr | 142.28 | 133.11 | 155.52 | 14.41 |
| May | 156.80 | 145.04 | 164.09 | 11.61 |
| Jun | 147.62 | 138.54 | 158.25 | 12.45 |
| Jul | 142.31 | 127.58 | 156.61 | 18.54 |
| Aug | 148.71 | 136.22 | 160.54 | 15.15 |
| Sep | 150.94 | 133.28 | 162.04 | 17.75 |
| Oct | 152.53 | 141.32 | 164.43 | 14.05 |
| Nov | 155.05 | 139.46 | 168.77 | 17.36 |
| Dec | 162.95 | 154.64 | 169.31 | 8.66 |
Phillips 66 Partners (PSX) Monthly Stock Prediction for 2026
| Month | Target | Pes. | Opt. | Vol., % |
|---|---|---|---|---|
| Jan | 160.75 | 154.72 | 176.91 | 12.54 |
| Feb | 158.10 | 147.19 | 165.93 | 11.29 |
| Mar | 169.96 | 160.27 | 179.65 | 10.79 |
| Apr | 154.41 | 142.59 | 171.55 | 16.88 |
| May | 152.55 | 139.28 | 162.62 | 14.35 |
| Jun | 136.31 | 130.17 | 146.53 | 11.16 |
| Jul | 133.44 | 129.24 | 140.45 | 7.98 |
| Aug | 146.06 | 129.84 | 156.13 | 16.84 |
| Sep | 166.43 | 155.45 | 177.41 | 12.38 |
| Oct | 188.15 | 165.57 | 200.28 | 17.33 |
| Nov | 172.06 | 155.03 | 185.74 | 16.54 |
| Dec | 170.51 | 160.03 | 187.65 | 14.72 |
Phillips 66 Partners (PSX) Monthly Stock Prediction for 2027
| Month | Target | Pes. | Opt. | Vol., % |
|---|---|---|---|---|
| Jan | 165.65 | 152.98 | 178.33 | 14.21 |
| Feb | 146.02 | 136.82 | 161.58 | 15.32 |
| Mar | 144.71 | 131.90 | 158.60 | 16.83 |
| Apr | 164.46 | 149.66 | 170.38 | 12.16 |
| May | 160.76 | 150.39 | 167.76 | 10.35 |
| Jun | 169.68 | 160.78 | 176.56 | 8.94 |
| Jul | 159.76 | 154.49 | 175.81 | 12.13 |
| Aug | 149.45 | 133.76 | 164.25 | 18.56 |
| Sep | 150.80 | 142.20 | 161.88 | 12.16 |
| Oct | 140.85 | 127.32 | 153.73 | 17.18 |
| Nov | 146.76 | 139.06 | 153.81 | 9.59 |
| Dec | 135.97 | 123.74 | 151.48 | 18.31 |
Phillips 66 Partners (PSX) Monthly Stock Prediction for 2028
| Month | Target | Pes. | Opt. | Vol., % |
|---|---|---|---|---|
| Jan | 130.67 | 124.99 | 145.37 | 14.02 |
| Feb | 125.58 | 117.10 | 135.37 | 13.50 |
| Mar | 137.63 | 121.73 | 142.38 | 14.50 |
| Apr | 129.99 | 125.70 | 139.94 | 10.17 |
| May | 148.91 | 134.83 | 154.94 | 12.97 |
| Jun | 149.80 | 134.30 | 167.78 | 19.96 |
| Jul | 139.91 | 134.88 | 155.44 | 13.23 |
| Aug | 141.17 | 135.24 | 146.89 | 7.93 |
| Sep | 132.28 | 120.97 | 141.01 | 14.21 |
| Oct | 128.90 | 120.98 | 137.41 | 11.96 |
| Nov | 121.17 | 117.17 | 133.53 | 12.25 |
| Dec | 115.90 | 108.77 | 128.07 | 15.07 |
Phillips 66 Partners information and performance
2331 CITYWEST BLVD., HOUSTON, TX, US
Market capitalization of the Phillips 66 Partners LP is the total market value of all issued shares of a company. It is calculated by the formula multiplying the number of PSX shares in the company outstanding by the market price of one share.
EBITDA of Phillips 66 Partners is earnings before interest, income tax and depreciation of assets.
P/E ratio (price to earnings) - shows the ratio between the price of a share and the company's profit
Price/earnings to growth
Dividend Per Share is a financial indicator equal to the ratio of the company's net profit available for distribution to the annual average of ordinary shares.
Dividend yield is a ratio that shows how much a company pays in dividends each year at the stock price.
EPS shows how much of the net profit is accounted for by the common share.
Trailing P/E depends on what has already been done. It uses the current share price and divides it by the total earnings per share for the last 12 months.
Forward P/E uses projections of future earnings instead of final numbers.
Enterprise Value (EV) /Revenue
The EV / EBITDA ratio shows the ratio of the cost (EV) to its profit before tax, interest and amortization (EBITDA).
Number of issued ordinary shares
Number of freely tradable shares
Shares Short Prior Month - the number of shares in short positions in the last month.
Phillips 66 Partners (PSX) stock dividend
Phillips 66 Partners last paid dividends on 08/20/2024. The next scheduled payment will be on 09/03/2024. The amount of dividends is $4.2 per share. If the date of the next dividend payment has not been updated, it means that the issuer has not yet announced the exact payment. As soon as information becomes available, we will immediately update the data. Bookmark our portal to stay updated.
Last Split Date: 01/01/1970
Splitting of shares is an increase in the number of securities of the issuing company circulating on the market due to a decrease in their value at constant capitalization.
For example, a 5: 1 ratio means that the value of one share will decrease 5 times, the total amount will increase 5 times. It is important to understand that this procedure does not change the capitalization of the company, as well as the total value of assets held in private hands.


