


July 14, 2024 This Week Top S&P 500 Gainers & Losers

Tesla Q2: The Bottom Is Likely In


Tesla: Time To Take Profits

Microsoft: The Q4 Results Should Surprise You

Tesla: Optimus And FSD Probably Won’t Save The Day

April 23, 2024 Maximizing Profits: When is the Right Time to Sell Your Business?

April 12, 2024 Improve Your Financial Status: A How-To Guide
April 12, 2024 How ZIM Integrated Container Tracking is Revolutionizing Global Trade

March 15, 2024 6 Best Growth Stocks To Buy Now According to Metatrader 5

Innovative Industrial Properties (IIPR) Stock Forecast for 2024–2028. Sell or Buy?
Updated: July 27, 2024 (02:48)
Sector: Real EstateThe share price of Innovative Industrial Properties, Inc. (IIPR) now
50/200 Day Moving Average: $111.11 / $96.52
This figure corresponds to the Average Price over the previous 50/200 days. For Innovative Industrial Properties stocks, the 50-day moving average is the support level today.
For Innovative Industrial Properties stocks, the 200-day moving average is the support level today.
Are you interested in Innovative Industrial Properties, Inc. stocks and want to buy them, or are they already in your portfolio? If yes, then on this page you will find useful information about the dynamics of the Innovative Industrial Properties stock price in 2024, 2025, 2026, 2027, 2028. How much will one Innovative Industrial Properties share be worth in 2024 - 2028?
When should I take profit in Innovative Industrial Properties stock? When should I record a loss on Innovative Industrial Properties stock? What are analysts' forecasts for Innovative Industrial Properties stock? What is the future of Innovative Industrial Properties stock? We forecast Innovative Industrial Properties stock performance using neural networks based on historical data on Innovative Industrial Properties stocks. Also, when forecasting, technical analysis tools are used, world geopolitical and news factors are taken into account.
Innovative Industrial Properties stock prediction results are shown below and presented in the form of graphs, tables and text information, divided into time intervals. (Next month, 2024, 2025, 2026, 2027 and 2028) The final quotes of the instrument at the close of the previous trading day are a signal to adjust the forecasts for Innovative Industrial Properties shares. This happens once a day.
Historical and forecast chart of Innovative Industrial Properties stock
The chart below shows the historical price of Innovative Industrial Properties stock and a prediction chart for the next month. For convenience, prices are divided by color. Forecast prices include: Optimistic Forecast, Pessimistic Forecast, and Weighted Average Best Forecast. Detailed values for the Innovative Industrial Properties stock price can be found in the table below.
Long-term forecasts by years.

Forecasting IIPR Stock Rates: Key Factors and Predictions

Innovative Industrial Properties (IIPR) is a prominent player in the cannabis REIT industry. Predicting IIPR stock rates involves analyzing several key factors that are poised to influence its future performance. Understanding these dynamics can help analysts and investors make informed decisions.
Factors Influencing IIPR Stock Rates
Growth of the Global Medical Cannabis Market: The market is expected to surge from $24.87 billion in 2024 to $69.75 billion by 2029, with a CAGR of 22.9%. This growth will increase tenant demand, boosting IIPR's revenue potential and, consequently, its stock value.
Strategic Real Estate Acquisitions: IIPR's keen ability to continuously acquire properties in key legalized states enhances its portfolio and potential income streams. Successful past acquisitions have driven strong stock returns and investor confidence, signaling promising future performance.
Strong AFFO Growth and Financial Health: Posting a robust AFFO of $63 million with an 82% payout ratio underscores IIPR’s operational efficiency. A low debt-to-total assets ratio of 11% and high liquidity ensure financial stability, contributing to sustained dividend payments and stock price attractiveness.
High Occupancy and Tenant Diversification: Maintaining a high occupancy rate of 95.2% across 108 properties and a diversified tenant base minimizes risk, ensuring stable income and making IIPR a safer investment.
Legal and Regulatory Challenges: While lucrative, the cannabis market also comes with regulatory hurdles. These challenges can create stock price volatility due to sudden changes impacting tenant operations and financial health.
- IIPR stock forecast looks promising given the industry's growth and strategic acquisitions.
- Analysts should consider market trends and IIPR's financial health for accurate stock price predictions.
In conclusion, factors like market growth, strategic acquisitions, strong AFFO growth, and tenant diversification will significantly impact IIPR stock price prediction. Understanding these variables allows analysts to provide accurate IIPR stock forecasts and guide investors on whether IIPR is a good stock to buy. Remaining aware of regulatory challenges is also crucial in making comprehensive IIPR stock buy or sell decisions.
Review the original Analysis

Forecasting IIPR Stock: Key Factors Shaping the Rates

As we delve into forecasting the stock rates for Innovative Industrial Properties (IIPR), several key factors stand to drive significant changes. From legislative shifts to macroeconomic conditions, understanding these elements is crucial for any seasoned analyst looking to make accurate predictions about IIPR stock prices.
Crucial Factors Influencing IIPR Stock Rates
Legislative risks predominantly tower as the most impactful. The potential passage of the SAFER Banking Act and changes due to cannabis rescheduling present a double-edged sword. If enacted, traditional capital sources could become accessible to cannabis operators, diminishing their reliance on IIPR's sale-leaseback model and subsequently reducing lease rates and acquisition opportunities. This legislative shift would invariably alter the demand dynamics, severely influencing IIPR stock forecast.
Equally significant are macroeconomic conditions like inflation and interest rates. Current high inflation and elevated Federal Reserve rates could depress REIT valuations, including IIPR. However, a favorable decline in inflation aligning with the Federal Reserve's targets could lead to lower interest rates, enhancing IIPR's capitalization rate spread and positively affecting Innovative Industrial Properties stock forecast.
For investors focused on income, IIPR's 6.5% dividend yield is appealing but it's worth noting that the yield’s sustainability hinges on tenants' financial health. Any distress among tenants could disrupt IIPR's revenue flow, posing a risk to its attractive dividend. Thus, tenant financial conditions are vital metrics for predicting IIPR stock price prediction accurately.
Furthermore, market sentiment and investor perception of both the cannabis industry and the REIT sector add another layer of complexity. Legislative changes boosting the industry or enhanced acceptance can invigorate market confidence and bolster IIPR stock price target. Conversely, negative news can prompt sell-offs, leading to stock volatility.
- Legislative Risks: SAFER Banking Act and Cannabis Rescheduling
- Macroeconomic Conditions: Inflation and Interest Rates
- Dividend Yield and Growth
- Tenant Financial Health
- Market Sentiment and Investor Perception
By meticulously analyzing these factors, analysts can derive a more nuanced IIPR stock forecast that considers legislative, economic, tenant-related, and market sentiment elements, providing a comprehensive view for potential investors. Understanding these dynamics can guide decisions on whether IIPR is a stock to buy or a risk to avoid.
Review the original Analysis

Is IIPR a Good Stock to Buy? Unpacking the Future with Federal Changes
For investors eyeing Innovative Industrial Properties (IIPR), the horizon holds noteworthy events that could significantly sway its stock rates. The impending federal reclassification of cannabis and the possible enactment of the SAFER Banking Act are the twin engines that might propel IIPR's stock forecast into a new era of growth. Analysts leveraging these indicators can craft a more precise IIPR stock price prediction, navigating through the opportunities these changes could unlock.
The Catalysts Behind IIPR's Stock Trajectory
The journey towards federal reclassification of cannabis from Schedule I to Schedule III stands as a monumental shift, promising fresh terrain for cannabis businesses. This, coupled with the anticipated passing of the SAFER Banking Act, frames a potentially prosperous picture for IIPR. These factors could radically improve liquidity and reduce tax costs, fostering an environment where IIPR's tenants — mainly state-sanctioned marijuana enterprises — could thrive. The ripple effect? A heightened demand for cannabis properties, fueling IIPR's stock price target upwards.
Analysts keen on delivering an accurate IIPR stock forecast will find these developments indispensable. The SAFER Banking Act's endorsement alone could rejig the banking landscape for cannabis companies, easing access to essential financial services. This improved access spells broader expansion capabilities for IIPR's tenants, directly impacting IIPR's growth trajectory. When debating 'IIPR stock buy or sell', these unfolding events provide a compelling narrative for why IIPR might just be a good stock to buy.
- Federal reclassification of cannabis
- Passing of the SAFER Banking Act
In sum, the blend of legislative advances and IIPR’s strategic positioning crafts a potent mix for stock rate hikes. Analysts gearing up to tweak their Innovative Industrial Properties stock forecast have their eyes glued to these developments, paving the path for informed investment decisions.
Review the original Analysis
Innovative Industrial Properties Inc., an industrial REIT that caters to operators of regulated cannabis facilities with a valid state license, could be a smart pick if you’re in for buying when prices drop. This ‘strong buy’ recommendation holds its ground thanks to consistently paying dividends despite a decline in its stock price, solid financials, favorable valuations and an upward trend in earnings revision.
Changes in monetary policy have dealt harsh blows to a range of sectors and industries, including real estate. Despite these challenges which include rising interest rates, analyst downgrades and broader economic headwinds, Innovative Industrial Properties still stands strong as a quant-rated ‘buy’. The stock has taken a hit, falling 23% YTD. However, its impressive dividend growth coupled with an upcoming 9.82% dividend yield makes it extremely attractive as we expect REITs to recover.
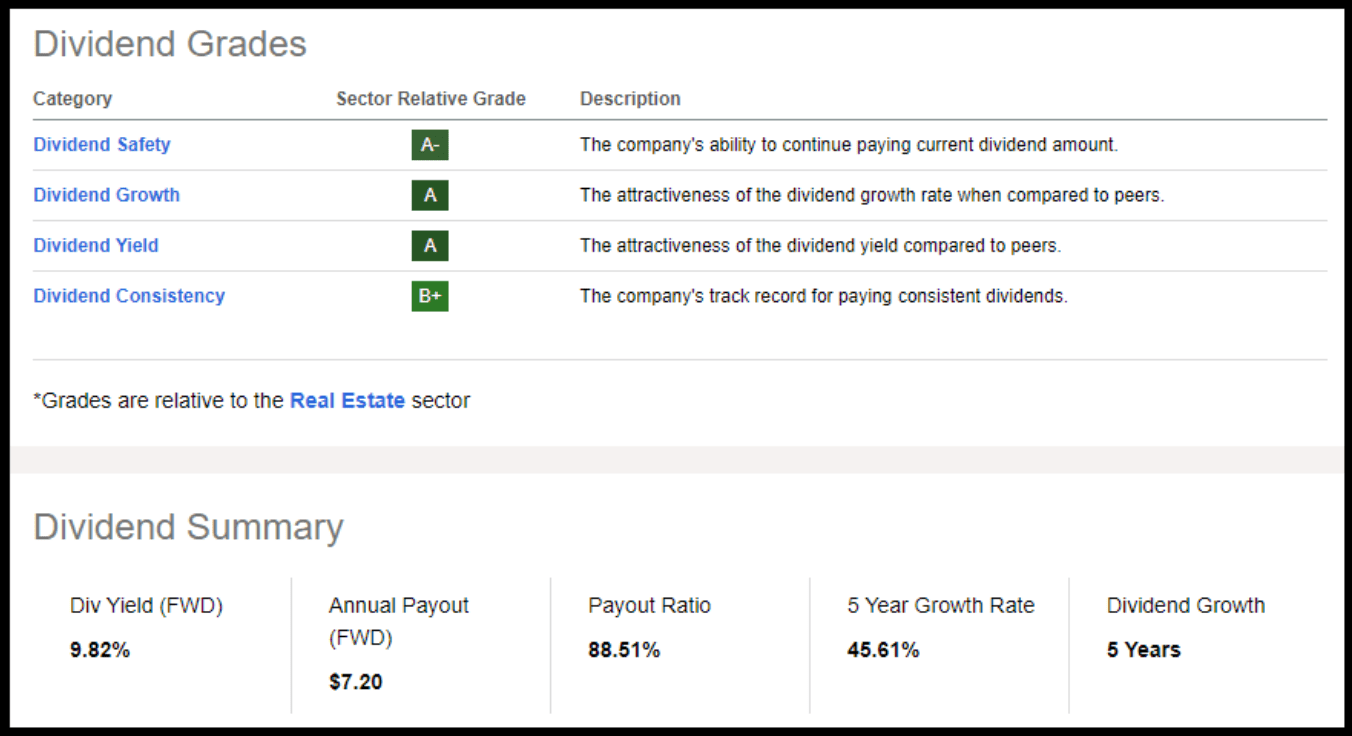
Innovative Industrials (IIPR) really stands out due to its impressive cash flow, remarkable growth, and the ability to uphold its dividend scorecard from the solid profitability it maintains. What’s noteworthy is that it boasts a healthy revenue influx and an advance in Adjusted Funds from Operations (AFFO) Growth which are a whole 141.12% greater compared to other businesses in the same sector.
Thanks to its hefty cash reserves, IIPR can proudly sustain its dividend and report a nearly 30% Compound Annual Growth Rate (CAGR) in dividends over the past three years. Also, it’s interesting that the company’s stock is trading below its peak price from the past year. This makes Innovative Industrials quite an attractive option given its forward Price to AFFO ratio stands at 9.14x, which is a 31% lower rate compared to other companies in this industry.
The cherry on top? The company’s Total Debt-to-Capital ratio for the trailing 12 months is astoundingly lower by -73.23% than its industry peers! Meaning, it has very little debt on its shoulders. Plus, IIPR focuses mostly on industrial properties, which don’t have much overhead costs; hence it’s able to keep expenses low—a smart strategy indeed!
Innovative Industrial Properties daily forecast for a month
| Date | Target | Pes. | Opt. | Vol., % |
|---|---|---|---|---|
| Jul 28 | 121.68 | 120.34 | 122.58 | 1.86 |
| Jul 29 | 122.65 | 121.72 | 123.39 | 1.37 |
| Jul 30 | 122.55 | 121.38 | 123.41 | 1.68 |
| Jul 31 | 122.73 | 121.28 | 123.22 | 1.60 |
| Aug 01 | 124.89 | 123.71 | 126.31 | 2.10 |
| Aug 02 | 124.24 | 123.12 | 125.78 | 2.16 |
| Aug 03 | 124.01 | 122.80 | 125.30 | 2.04 |
| Aug 04 | 123.96 | 123.39 | 125.72 | 1.89 |
| Aug 05 | 121.95 | 120.52 | 123.39 | 2.39 |
| Aug 06 | 121.20 | 120.45 | 121.93 | 1.23 |
| Aug 07 | 119.87 | 118.81 | 120.97 | 1.82 |
| Aug 08 | 120.61 | 118.87 | 121.14 | 1.91 |
| Aug 09 | 120.49 | 119.76 | 121.45 | 1.41 |
| Aug 10 | 122.85 | 121.94 | 124.30 | 1.93 |
| Aug 11 | 125.11 | 123.21 | 126.81 | 2.92 |
| Aug 12 | 125.51 | 123.80 | 126.54 | 2.21 |
| Aug 13 | 125.54 | 123.68 | 127.29 | 2.92 |
| Aug 14 | 127.14 | 126.02 | 128.59 | 2.04 |
| Aug 15 | 126.05 | 124.74 | 126.75 | 1.62 |
| Aug 16 | 125.39 | 124.54 | 126.55 | 1.61 |
| Aug 17 | 124.57 | 123.17 | 125.41 | 1.82 |
| Aug 18 | 122.82 | 121.13 | 124.34 | 2.66 |
| Aug 19 | 122.40 | 120.62 | 122.99 | 1.97 |
| Aug 20 | 121.52 | 120.26 | 122.57 | 1.92 |
| Aug 21 | 121.79 | 121.21 | 122.28 | 0.88 |
| Aug 22 | 120.62 | 119.66 | 121.49 | 1.53 |
| Aug 23 | 121.75 | 119.88 | 122.58 | 2.25 |
| Aug 24 | 120.39 | 119.72 | 121.23 | 1.27 |
| Aug 25 | 120.49 | 119.81 | 122.22 | 2.01 |
| Aug 26 | 121.11 | 119.68 | 122.40 | 2.27 |
Innovative Industrial Properties Daily Price Targets
Innovative Industrial Properties Stock Forecast 07-28-2024.
Forecast target price for 07-28-2024: $121.68.
Negative dynamics for Innovative Industrial Properties shares will prevail with possible volatility of 1.827%.
Pessimistic target level: 120.34
Optimistic target level: 122.58
Innovative Industrial Properties Stock Forecast 07-29-2024.
Forecast target price for 07-29-2024: $122.65.
Positive dynamics for Innovative Industrial Properties shares will prevail with possible volatility of 1.352%.
Pessimistic target level: 121.72
Optimistic target level: 123.39
Innovative Industrial Properties Stock Forecast 07-30-2024.
Forecast target price for 07-30-2024: $122.55.
Negative dynamics for Innovative Industrial Properties shares will prevail with possible volatility of 1.648%.
Pessimistic target level: 121.38
Optimistic target level: 123.41
Innovative Industrial Properties Stock Forecast 07-31-2024.
Forecast target price for 07-31-2024: $122.73.
Positive dynamics for Innovative Industrial Properties shares will prevail with possible volatility of 1.574%.
Pessimistic target level: 121.28
Optimistic target level: 123.22
Innovative Industrial Properties Stock Forecast 08-01-2024.
Forecast target price for 08-01-2024: $124.89.
Positive dynamics for Innovative Industrial Properties shares will prevail with possible volatility of 2.057%.
Pessimistic target level: 123.71
Optimistic target level: 126.31
Innovative Industrial Properties Stock Forecast 08-02-2024.
Forecast target price for 08-02-2024: $124.24.
Negative dynamics for Innovative Industrial Properties shares will prevail with possible volatility of 2.114%.
Pessimistic target level: 123.12
Optimistic target level: 125.78
IIPR (IIPR) Monthly Stock Prediction for 2024
| Month | Target | Pes. | Opt. | Vol., % |
|---|---|---|---|---|
| Aug. | 118.17 | 109.88 | 122.85 | 10.56 |
| Sep. | 121.04 | 114.29 | 123.66 | 7.58 |
| Oct. | 122.35 | 114.20 | 128.74 | 11.29 |
| Nov. | 122.35 | 115.97 | 129.62 | 10.53 |
| Dec. | 127.75 | 120.73 | 136.83 | 11.76 |
Innovative Industrial Properties forecast for this year
Innovative Industrial Properties Stock Prediction for Aug 2024
An downtrend is forecast for this month with an optimal target price of $118.173. Pessimistic: $109.88. Optimistic: $122.85
Innovative Industrial Properties Stock Prediction for Sep 2024
An uptrend is forecast for this month with an optimal target price of $121.044. Pessimistic: $114.29. Optimistic: $123.66
Innovative Industrial Properties Stock Prediction for Oct 2024
An uptrend is forecast for this month with an optimal target price of $122.351. Pessimistic: $114.20. Optimistic: $128.74
Innovative Industrial Properties Stock Prediction for Nov 2024
An downtrend is forecast for this month with an optimal target price of $122.351. Pessimistic: $115.97. Optimistic: $129.62
Innovative Industrial Properties Stock Prediction for Dec 2024
An uptrend is forecast for this month with an optimal target price of $127.747. Pessimistic: $120.73. Optimistic: $136.83
Innovative Industrial Properties (IIPR) Monthly Stock Prediction for 2025
| Month | Target | Pes. | Opt. | Vol., % |
|---|---|---|---|---|
| Jan | 128.78 | 122.87 | 137.48 | 10.62 |
| Feb | 126.81 | 119.51 | 135.83 | 12.02 |
| Mar | 131.03 | 123.13 | 137.17 | 10.23 |
| Apr | 126.20 | 123.59 | 132.56 | 6.77 |
| May | 132.22 | 125.44 | 135.43 | 7.38 |
| Jun | 122.10 | 117.27 | 126.61 | 7.38 |
| Jul | 121.99 | 119.80 | 127.81 | 6.27 |
| Aug | 126.94 | 122.14 | 135.05 | 9.56 |
| Sep | 130.82 | 124.46 | 135.76 | 8.33 |
| Oct | 127.41 | 119.49 | 132.79 | 10.02 |
| Nov | 123.97 | 117.16 | 128.21 | 8.62 |
| Dec | 132.33 | 126.26 | 138.53 | 8.86 |
Innovative Industrial Properties (IIPR) Monthly Stock Prediction for 2026
| Month | Target | Pes. | Opt. | Vol., % |
|---|---|---|---|---|
| Jan | 139.72 | 131.54 | 145.00 | 9.28 |
| Feb | 149.90 | 145.59 | 155.70 | 6.50 |
| Mar | 147.34 | 143.89 | 151.98 | 5.32 |
| Apr | 144.16 | 137.93 | 150.00 | 8.04 |
| May | 138.97 | 130.34 | 143.34 | 9.07 |
| Jun | 144.22 | 136.43 | 149.54 | 8.77 |
| Jul | 152.92 | 147.00 | 159.66 | 7.93 |
| Aug | 161.04 | 150.02 | 165.24 | 9.21 |
| Sep | 159.15 | 154.14 | 165.60 | 6.92 |
| Oct | 156.00 | 149.54 | 165.83 | 9.82 |
| Nov | 142.66 | 135.73 | 149.08 | 8.96 |
| Dec | 140.22 | 136.69 | 149.44 | 8.53 |
Innovative Industrial Properties (IIPR) Monthly Stock Prediction for 2027
| Month | Target | Pes. | Opt. | Vol., % |
|---|---|---|---|---|
| Jan | 138.33 | 128.62 | 144.18 | 10.79 |
| Feb | 140.32 | 134.39 | 149.29 | 9.98 |
| Mar | 151.94 | 147.84 | 157.14 | 5.92 |
| Apr | 151.94 | 142.78 | 157.68 | 9.45 |
| May | 149.34 | 139.40 | 154.05 | 9.51 |
| Jun | 148.27 | 145.07 | 158.28 | 8.35 |
| Jul | 151.87 | 148.45 | 159.52 | 6.94 |
| Aug | 148.86 | 140.15 | 155.56 | 9.90 |
| Sep | 151.94 | 143.88 | 155.36 | 7.39 |
| Oct | 152.22 | 147.01 | 155.23 | 5.30 |
| Nov | 138.93 | 133.30 | 147.56 | 9.66 |
| Dec | 133.18 | 130.78 | 139.77 | 6.43 |
Innovative Industrial Properties (IIPR) Monthly Stock Prediction for 2028
| Month | Target | Pes. | Opt. | Vol., % |
|---|---|---|---|---|
| Jan | 133.90 | 131.13 | 139.92 | 6.29 |
| Feb | 134.26 | 129.79 | 137.40 | 5.54 |
| Mar | 138.85 | 129.35 | 145.85 | 11.31 |
| Apr | 132.73 | 129.86 | 139.66 | 7.01 |
| May | 144.19 | 140.30 | 147.83 | 5.09 |
| Jun | 144.19 | 140.43 | 153.15 | 8.30 |
| Jul | 157.04 | 150.68 | 167.78 | 10.19 |
| Aug | 165.10 | 159.75 | 175.35 | 8.90 |
| Sep | 172.38 | 166.17 | 178.59 | 6.95 |
| Oct | 173.62 | 169.71 | 185.65 | 8.58 |
| Nov | 170.34 | 161.29 | 177.39 | 9.07 |
| Dec | 164.67 | 156.66 | 174.15 | 10.04 |
Innovative Industrial Properties information and performance
1389 CENTER DRIVE, SUITE 200, PARK CITY, UT, US
Market capitalization of the Innovative Industrial Properties, Inc. is the total market value of all issued shares of a company. It is calculated by the formula multiplying the number of IIPR shares in the company outstanding by the market price of one share.
EBITDA of Innovative Industrial Properties is earnings before interest, income tax and depreciation of assets.
P/E ratio (price to earnings) - shows the ratio between the price of a share and the company's profit
Price/earnings to growth
Dividend Per Share is a financial indicator equal to the ratio of the company's net profit available for distribution to the annual average of ordinary shares.
Dividend yield is a ratio that shows how much a company pays in dividends each year at the stock price.
EPS shows how much of the net profit is accounted for by the common share.
Trailing P/E depends on what has already been done. It uses the current share price and divides it by the total earnings per share for the last 12 months.
Forward P/E uses projections of future earnings instead of final numbers.
Enterprise Value (EV) /Revenue
The EV / EBITDA ratio shows the ratio of the cost (EV) to its profit before tax, interest and amortization (EBITDA).
Number of issued ordinary shares
Number of freely tradable shares
Shares Short Prior Month - the number of shares in short positions in the last month.
Innovative Industrial Properties (IIPR) stock dividend
Innovative Industrial Properties last paid dividends on 06/28/2024. The next scheduled payment will be on 07/15/2024. The amount of dividends is $7.24 per share. If the date of the next dividend payment has not been updated, it means that the issuer has not yet announced the exact payment. As soon as information becomes available, we will immediately update the data. Bookmark our portal to stay updated.
Last Split Date: 01/01/1970
Splitting of shares is an increase in the number of securities of the issuing company circulating on the market due to a decrease in their value at constant capitalization.
For example, a 5: 1 ratio means that the value of one share will decrease 5 times, the total amount will increase 5 times. It is important to understand that this procedure does not change the capitalization of the company, as well as the total value of assets held in private hands.
Related stocks from Real Estate sector


