


June 28, 2024 PCE Inflation Trends: Insights On Consumer Price Index

Wall Street Lunch: Tesla Delivers For Investors

3M: A Dividend Cutter With A Strong Buy Rating


Tesla: I Am Shorting As Growth Story Dwindles

April 23, 2024 Maximizing Profits: When is the Right Time to Sell Your Business?

April 12, 2024 Improve Your Financial Status: A How-To Guide
April 12, 2024 How ZIM Integrated Container Tracking is Revolutionizing Global Trade

March 15, 2024 6 Best Growth Stocks To Buy Now According to Metatrader 5

Bank of America (BAC) Stock Forecast for 2024–2028. Sell or Buy?
Updated: July 3, 2024 (18:58)
Sector: FinancialThe share price of Bank of America Corp. (BAC) now
50/200 Day Moving Average: $38.76 / $33.54
This figure corresponds to the Average Price over the previous 50/200 days. For Bank of America stocks, the 50-day moving average is the support level today.
For Bank of America stocks, the 200-day moving average is the support level today.
Are you interested in Bank of America Corp. stocks and want to buy them, or are they already in your portfolio? If yes, then on this page you will find useful information about the dynamics of the Bank of America stock price in 2024, 2025, 2026, 2027, 2028. How much will one Bank of America share be worth in 2024 - 2028?
When should I take profit in Bank of America stock? When should I record a loss on Bank of America stock? What are analysts' forecasts for Bank of America stock? What is the future of Bank of America stock? We forecast Bank of America stock performance using neural networks based on historical data on Bank of America stocks. Also, when forecasting, technical analysis tools are used, world geopolitical and news factors are taken into account.
Bank of America stock prediction results are shown below and presented in the form of graphs, tables and text information, divided into time intervals. (Next month, 2024, 2025, 2026, 2027 and 2028) The final quotes of the instrument at the close of the previous trading day are a signal to adjust the forecasts for Bank of America shares. This happens once a day.
Historical and forecast chart of Bank of America stock
The chart below shows the historical price of Bank of America stock and a prediction chart for the next month. For convenience, prices are divided by color. Forecast prices include: Optimistic Forecast, Pessimistic Forecast, and Weighted Average Best Forecast. Detailed values for the Bank of America stock price can be found in the table below.
Long-term forecasts by years.

Bank of America Stock Forecast: Navigating Through Interest Rates and Credit Trends

As we delve into the future of Bank of America (BAC) stock prices, the landscape appears to be significantly shaped by a trio of key events and factors. For investors pondering whether BAC is a good stock to buy, understanding these elements becomes crucial. At the forefront is the role of interest rates, a vital catalyst in determining preferred dividend yields and the attractiveness of BAC stock. A decrease in interest rates often signals an increase in the yields on preferred shares like BAC.PR.P and BAC.PR.L, potentially making them more appealing to investors. This dynamic interplay offers analysts a powerful tool to use in predicting changes in BAC's stock prices with greater precision.
The Ripple Effects of Credit and Real Estate Concerns
Further compounding the complexity of the BAC stock forecast are two interconnected concerns: credit card debt and default rates, along with the bank's exposure to commercial real estate. A spike in default rates within Bank of America's credit card portfolio could threaten the bank's profitability, casting shadows of doubt on the BAC stock price target. Similarly, while the bank's direct exposure to commercial real estate is described as relatively modest, adverse movements in this sector, such as an uptick in loan defaults or a downturn in property values, could put additional pressure on BAC's financial outlook.
These factors collectively provide a roadmap for analysts aiming to craft a nuanced BAC stock price prediction. By closely monitoring interest rates, credit card debt, default rates, and commercial real estate trends, analysts can potentially formulate a more accurate forecast, determining if BAC stock is a buy or sell. For investors eyeing the Bank of America stock forecast, these metrics serve as indispensable tools for making informed decisions in a fluctuating financial landscape.
Review the original Analysis

Bank of America's Stock Outlook: Navigating Through Key Financial Waters

In the bustling world of financial markets, the trajectory of Bank of America's (BAC) stock remains a hot topic among investors. As analysts pore over charts and data, certain pivotal factors emerge as key influencers of BAC's stock forecast. A close look at these elements reveals how they could mold the future of BAC's stock rates, making it either a compelling buy or a cautious sell.
Cracking the Code: Predicting BAC's Stock Movements
At the heart of BAC's stock price prediction are interest rates, which stand as the linchpin affecting its valuation. A dip in these rates could ignite loan demand, reducing the bank's funding costs and potentially fattening its net interest income, painting a rosy picture for its profitability. This scenario could sway analysts to peg BAC as a good stock to buy, buoying its stock price target.
Furthermore, an upswing in loan demand, particularly in residential mortgages, together with a rebound in non-interest income from avenues such as investment banking and asset management, could further embellish BAC's revenue streams. However, the path isn't devoid of thorns. The specter of rising delinquency rates and exposure to commercial real estate loans could cast a shadow over its asset quality, urging a more cautious approach in the BAC stock buy or sell decision.
Lastly, the broader stock market performance, especially within the banking sector, can sway general sentiment, affecting the demand for BAC shares. Using these insights, analysts can navigate the murky waters of stock prediction with a sharper compass, making informed recommendations on whether to buy or sell Bank of America stock. In essence, keeping a vigilant eye on these variables could hold the key to unlocking the most accurate forecasts for BAC's stock price.
As these factors intertwine, their combined effect will no doubt shape the trajectory of Bank of America’s stock in the near future. Analysts and investors alike would do well to monitor these indicators closely, as they craft their strategies around BAC’s stock forecast.
Review the original Analysis

Bank of America (BAC) Stocks: Poised for Potential Growth?
As investors and analysts look to forecast the future of Bank of America's stock rates, several critical events and factors loom large in their calculations. Chief among these is the company's current valuation, which stands noticeably lower than its competitors like J.P. Morgan and Citigroup. This presents a ripe opportunity for growth, suggesting that BAC stock might be undervalued and could see significant price appreciation. Furthermore, with consumer credit card debt levels under scrutiny, it's essential to consider the improving charge-off rates which signal a potentially manageable impact on BAC's profitability, tempering fears of massive defaults.
Navigating the Financial Landscape
The regulatory environment, spearheaded by the looming Basel III "Endgame" and prospective rate hikes, introduces a layer of uncertainty that can't be ignored. Analysts leveraging these factors for BAC stock price prediction require a nuanced approach, weighing the potential for a tighter regulatory climate against the expected benefits of a looser monetary policy. By analyzing these elements—valuation, consumer debt levels, and the regulatory backdrop—an analyst can craft a more accurate BAC stock forecast. As these variables interact, their collective influence will be pivotal in shaping the trajectory of Bank of America's stock.
Ultimately, in determining whether BAC stock is a buy or sell, savvy investors must consider these interconnected factors. The stock's current valuation, the evolving landscape of consumer debt, and looming regulatory changes collectively hold the key to unlocking the most accurate BAC stock price prediction.
- Is BAC a good stock to buy?
- BAC stock buy or sell?
- Bank of America stock forecast
As we navigate these questions, the answer may very well hinge on how effectively the market absorbs and responds to these pivotal influences.
Review the original Analysis
- Bank of America successfully adapted its business model by using some assets from the 2008 Federal Reserve aid package, which are now part of the bank’s subsidiaries.
- Mark-to-market valuations have negligible impacts on its operations as long as it holds on to securities until they mature and assumes constant operations. On the downside, “mark-to-market” symbolizes an opportunity cost that companies need to embrace for assured future gains.
- The bank principally focuses on managing incoming and outgoing cash flows to yield profits. It doesn’t excessively worry about unpredictable market conditions.
BAC is set to make significant financial gains as the ill-conceived, held-to-maturity securities that have been generating losses eventually roll off. The stock right now upgrades to a ‘Buy’ rating with an anticipated 7%-9% annual return over the long haul.
The stock has been performing admirably, even outpacing both the broader S&P 500 (SPY) and the illustrious “Magnificent 7”.
So what’s fueling these returns?
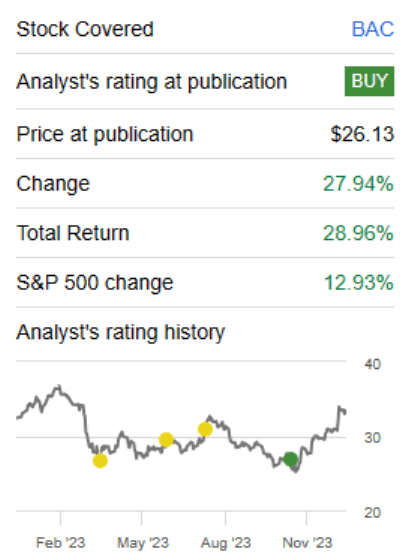
A whopping 29% total return over three months might lead you to believe that BAC has either reinvented some financial mechanism or tapped into the lucrative AI market. But far from it. The reality is that earnings estimates have seen a reluctant dip in the past month.
What’s really driving this is essentially market risk for a harsh recession being priced out. There are plenty of metrics you could consider for this, but Baa corporate bond yields (that teeter on investment-grade) and their spreads to US Treasuries have served as a terrific reverse indicator for BAC stock.
Given that yield is nearing its year-long low, you’d need to start questioning your future predictions for this and other risk factors.
About the Company
Bank of America is an international corporation operating in 35 countries. The company has 213,000 employees, 16,000 ATMs and 4,700 offices across America. It is engaged in three areas: lending to individuals and servicing their accounts; helping corporations manage assets; and trading on currency, stock, and commodity exchanges.
In 2015, Forbes ranked Bank of America as the twenty-third largest company in the world. In 2016, the bank became the largest in the United States in terms of assets. In 2016, the company earned $ 83.7 billion.
The company has been around since 1904, when Amadeo Giannini founded the Bank of Italy in San Francisco. Bank Giannini was different from other banks of the early 20th century: it had 100 branches, which served the middle class and immigrants – other banks in the city did not give them loans. After the 1906 earthquake, the Bank of Italy retained its building and money, unlike other banks. Giannini took advantage of the saved resources and began issuing recovery loans a few days after the disaster. In 1929 Bank of Italy merged with Los Angeles-based Bank of America. The United Bank received the name of the latter.
Bank of America daily forecast for a month
| Date | Target | Pes. | Opt. | Vol., % |
|---|---|---|---|---|
| Jul 05 | 40.99 | 40.13 | 41.68 | 3.86 |
| Jul 06 | 40.38 | 39.69 | 40.70 | 2.53 |
| Jul 07 | 40.28 | 39.33 | 40.82 | 3.78 |
| Jul 08 | 39.91 | 39.28 | 40.50 | 3.11 |
| Jul 09 | 40.25 | 39.75 | 40.77 | 2.55 |
| Jul 10 | 40.55 | 39.78 | 41.16 | 3.46 |
| Jul 11 | 40.55 | 39.82 | 40.99 | 2.93 |
| Jul 12 | 40.45 | 39.58 | 40.87 | 3.25 |
| Jul 13 | 40.94 | 40.20 | 41.69 | 3.70 |
| Jul 14 | 41.23 | 40.65 | 41.48 | 2.04 |
| Jul 15 | 41.85 | 41.14 | 42.82 | 4.09 |
| Jul 16 | 43.02 | 42.01 | 43.30 | 3.07 |
| Jul 17 | 43.21 | 42.34 | 44.17 | 4.32 |
| Jul 18 | 43.72 | 43.15 | 44.24 | 2.52 |
| Jul 19 | 43.19 | 42.60 | 44.11 | 3.56 |
| Jul 20 | 42.99 | 42.61 | 43.41 | 1.88 |
| Jul 21 | 43.15 | 42.62 | 43.49 | 2.04 |
| Jul 22 | 42.74 | 42.12 | 43.45 | 3.13 |
| Jul 23 | 42.88 | 42.11 | 43.52 | 3.36 |
| Jul 24 | 41.99 | 41.05 | 42.65 | 3.90 |
| Jul 25 | 42.27 | 41.71 | 42.71 | 2.40 |
| Jul 26 | 41.22 | 40.39 | 41.92 | 3.80 |
| Jul 27 | 42.28 | 42.03 | 42.64 | 1.45 |
| Jul 28 | 42.65 | 42.25 | 43.67 | 3.36 |
| Jul 29 | 43.43 | 43.03 | 44.19 | 2.70 |
| Jul 30 | 44.06 | 43.16 | 44.37 | 2.82 |
| Jul 31 | 43.82 | 42.94 | 44.47 | 3.58 |
| Aug 01 | 43.70 | 43.12 | 44.28 | 2.68 |
| Aug 02 | 43.33 | 42.32 | 44.28 | 4.64 |
| Aug 03 | 42.43 | 42.05 | 42.92 | 2.06 |
Bank of America Daily Price Targets
Bank of America Stock Forecast 07-05-2024.
Forecast target price for 07-05-2024: $40.99.
Positive dynamics for Bank of America shares will prevail with possible volatility of 3.717%.
Pessimistic target level: 40.13
Optimistic target level: 41.68
Bank of America Stock Forecast 07-06-2024.
Forecast target price for 07-06-2024: $40.38.
Negative dynamics for Bank of America shares will prevail with possible volatility of 2.471%.
Pessimistic target level: 39.69
Optimistic target level: 40.70
Bank of America Stock Forecast 07-07-2024.
Forecast target price for 07-07-2024: $40.28.
Negative dynamics for Bank of America shares will prevail with possible volatility of 3.641%.
Pessimistic target level: 39.33
Optimistic target level: 40.82
Bank of America Stock Forecast 07-08-2024.
Forecast target price for 07-08-2024: $39.91.
Negative dynamics for Bank of America shares will prevail with possible volatility of 3.016%.
Pessimistic target level: 39.28
Optimistic target level: 40.50
Bank of America Stock Forecast 07-09-2024.
Forecast target price for 07-09-2024: $40.25.
Positive dynamics for Bank of America shares will prevail with possible volatility of 2.488%.
Pessimistic target level: 39.75
Optimistic target level: 40.77
Bank of America Stock Forecast 07-10-2024.
Forecast target price for 07-10-2024: $40.55.
Positive dynamics for Bank of America shares will prevail with possible volatility of 3.340%.
Pessimistic target level: 39.78
Optimistic target level: 41.16
BAC (BAC) Monthly Stock Prediction for 2024
| Month | Target | Pes. | Opt. | Vol., % |
|---|---|---|---|---|
| Aug. | 41.41 | 40.40 | 43.21 | 6.51 |
| Sep. | 43.35 | 41.68 | 44.32 | 5.96 |
| Oct. | 42.68 | 41.91 | 44.66 | 6.16 |
| Nov. | 42.95 | 40.79 | 43.56 | 6.35 |
| Dec. | 40.82 | 40.02 | 41.48 | 3.51 |
Bank of America forecast for this year
Bank of America Stock Prediction for Aug 2024
An uptrend is forecast for this month with an optimal target price of $41.4104. Pessimistic: $40.40. Optimistic: $43.21
Bank of America Stock Prediction for Sep 2024
An uptrend is forecast for this month with an optimal target price of $43.3525. Pessimistic: $41.68. Optimistic: $44.32
Bank of America Stock Prediction for Oct 2024
An downtrend is forecast for this month with an optimal target price of $42.6849. Pessimistic: $41.91. Optimistic: $44.66
Bank of America Stock Prediction for Nov 2024
An uptrend is forecast for this month with an optimal target price of $42.9538. Pessimistic: $40.79. Optimistic: $43.56
Bank of America Stock Prediction for Dec 2024
An downtrend is forecast for this month with an optimal target price of $40.819. Pessimistic: $40.02. Optimistic: $41.48
Bank of America (BAC) Monthly Stock Prediction for 2025
| Month | Target | Pes. | Opt. | Vol., % |
|---|---|---|---|---|
| Jan | 40.25 | 39.29 | 41.88 | 6.19 |
| Feb | 41.01 | 39.00 | 41.96 | 7.05 |
| Mar | 40.78 | 38.61 | 42.26 | 8.65 |
| Apr | 40.44 | 38.79 | 41.96 | 7.55 |
| May | 40.80 | 40.15 | 42.06 | 4.55 |
| Jun | 40.49 | 38.85 | 42.39 | 8.36 |
| Jul | 37.94 | 36.85 | 39.96 | 7.78 |
| Aug | 39.37 | 38.27 | 41.16 | 7.03 |
| Sep | 41.94 | 39.76 | 43.11 | 7.76 |
| Oct | 43.64 | 41.78 | 45.93 | 9.05 |
| Nov | 45.47 | 43.31 | 47.89 | 9.57 |
| Dec | 48.24 | 46.82 | 49.76 | 5.90 |
Bank of America (BAC) Monthly Stock Prediction for 2026
| Month | Target | Pes. | Opt. | Vol., % |
|---|---|---|---|---|
| Jan | 48.48 | 46.24 | 49.56 | 6.71 |
| Feb | 47.90 | 45.99 | 48.71 | 5.58 |
| Mar | 48.97 | 48.05 | 49.93 | 3.78 |
| Apr | 50.07 | 49.12 | 51.19 | 4.04 |
| May | 48.98 | 48.30 | 50.53 | 4.41 |
| Jun | 49.57 | 47.83 | 51.02 | 6.26 |
| Jul | 47.90 | 46.86 | 50.11 | 6.49 |
| Aug | 46.83 | 45.94 | 48.76 | 5.78 |
| Sep | 46.17 | 44.85 | 46.82 | 4.21 |
| Oct | 45.82 | 44.50 | 48.25 | 7.78 |
| Nov | 42.96 | 40.74 | 45.22 | 9.91 |
| Dec | 42.39 | 40.28 | 43.61 | 7.62 |
Bank of America (BAC) Monthly Stock Prediction for 2027
| Month | Target | Pes. | Opt. | Vol., % |
|---|---|---|---|---|
| Jan | 42.98 | 40.58 | 45.24 | 10.31 |
| Feb | 41.78 | 39.47 | 43.10 | 8.42 |
| Mar | 40.55 | 38.68 | 42.48 | 8.95 |
| Apr | 43.16 | 40.93 | 43.98 | 6.94 |
| May | 46.03 | 43.75 | 47.74 | 8.37 |
| Jun | 46.00 | 43.78 | 46.68 | 6.21 |
| Jul | 45.20 | 42.86 | 46.53 | 7.89 |
| Aug | 47.79 | 46.55 | 48.86 | 4.72 |
| Sep | 49.03 | 48.21 | 50.57 | 4.68 |
| Oct | 47.90 | 46.35 | 48.63 | 4.69 |
| Nov | 48.23 | 46.41 | 50.90 | 8.82 |
| Dec | 45.50 | 44.03 | 46.93 | 6.18 |
Bank of America (BAC) Monthly Stock Prediction for 2028
| Month | Target | Pes. | Opt. | Vol., % |
|---|---|---|---|---|
| Jan | 46.80 | 45.66 | 47.82 | 4.52 |
| Feb | 45.30 | 42.92 | 47.26 | 9.19 |
| Mar | 44.47 | 43.48 | 45.53 | 4.51 |
| Apr | 46.74 | 45.73 | 47.43 | 3.59 |
| May | 49.20 | 48.27 | 50.44 | 4.30 |
| Jun | 52.37 | 51.60 | 54.09 | 4.61 |
| Jul | 54.90 | 52.59 | 56.47 | 6.87 |
| Aug | 57.32 | 54.87 | 58.20 | 5.72 |
| Sep | 56.68 | 54.49 | 58.30 | 6.53 |
| Oct | 57.47 | 55.34 | 59.56 | 7.09 |
| Nov | 53.53 | 51.80 | 55.44 | 6.56 |
| Dec | 52.29 | 49.76 | 54.16 | 8.11 |
Bank of America information and performance
BANK OF AMERICA CORPORATE CENTER, 100 N TRYON ST, CHARLOTTE, NC, US
Market capitalization of the Bank of America Corp. is the total market value of all issued shares of a company. It is calculated by the formula multiplying the number of BAC shares in the company outstanding by the market price of one share.
EBITDA of Bank of America is earnings before interest, income tax and depreciation of assets.
P/E ratio (price to earnings) - shows the ratio between the price of a share and the company's profit
Price/earnings to growth
Dividend Per Share is a financial indicator equal to the ratio of the company's net profit available for distribution to the annual average of ordinary shares.
Dividend yield is a ratio that shows how much a company pays in dividends each year at the stock price.
EPS shows how much of the net profit is accounted for by the common share.
Trailing P/E depends on what has already been done. It uses the current share price and divides it by the total earnings per share for the last 12 months.
Forward P/E uses projections of future earnings instead of final numbers.
Enterprise Value (EV) /Revenue
The EV / EBITDA ratio shows the ratio of the cost (EV) to its profit before tax, interest and amortization (EBITDA).
Number of issued ordinary shares
Number of freely tradable shares
Shares Short Prior Month - the number of shares in short positions in the last month.
Bank of America (BAC) stock dividend
Bank of America last paid dividends on 06/07/2024. The next scheduled payment will be on 06/28/2024. The amount of dividends is $0.94 per share. If the date of the next dividend payment has not been updated, it means that the issuer has not yet announced the exact payment. As soon as information becomes available, we will immediately update the data. Bookmark our portal to stay updated.
Last Split Date: 01/01/1970
Splitting of shares is an increase in the number of securities of the issuing company circulating on the market due to a decrease in their value at constant capitalization.
For example, a 5: 1 ratio means that the value of one share will decrease 5 times, the total amount will increase 5 times. It is important to understand that this procedure does not change the capitalization of the company, as well as the total value of assets held in private hands.
Related stocks from Financial sector


