


July 14, 2024 This Week Top S&P 500 Gainers & Losers

Tesla: Time To Take Profits

Microsoft: The Q4 Results Should Surprise You

Tesla: Optimus And FSD Probably Won’t Save The Day


April 23, 2024 Maximizing Profits: When is the Right Time to Sell Your Business?

April 12, 2024 Improve Your Financial Status: A How-To Guide
April 12, 2024 How ZIM Integrated Container Tracking is Revolutionizing Global Trade

March 15, 2024 6 Best Growth Stocks To Buy Now According to Metatrader 5

Comcast (CMCSA) Stock Forecast for 2024–2028. Sell or Buy?
Updated: July 26, 2024 (20:06)
Sector: Communication servicesThe share price of Comcast Corp. (CMCSA) now
50/200 Day Moving Average: $38.65 / $41.39
This figure corresponds to the Average Price over the previous 50/200 days. For Comcast stocks, the 50-day moving average is the resistance level today.
For Comcast stocks, the 200-day moving average is the resistance level today.
Are you interested in Comcast Corp. stocks and want to buy them, or are they already in your portfolio? If yes, then on this page you will find useful information about the dynamics of the Comcast stock price in 2024, 2025, 2026, 2027, 2028. How much will one Comcast share be worth in 2024 - 2028?
When should I take profit in Comcast stock? When should I record a loss on Comcast stock? What are analysts' forecasts for Comcast stock? What is the future of Comcast stock? We forecast Comcast stock performance using neural networks based on historical data on Comcast stocks. Also, when forecasting, technical analysis tools are used, world geopolitical and news factors are taken into account.
Comcast stock prediction results are shown below and presented in the form of graphs, tables and text information, divided into time intervals. (Next month, 2024, 2025, 2026, 2027 and 2028) The final quotes of the instrument at the close of the previous trading day are a signal to adjust the forecasts for Comcast shares. This happens once a day.
Historical and forecast chart of Comcast stock
The chart below shows the historical price of Comcast stock and a prediction chart for the next month. For convenience, prices are divided by color. Forecast prices include: Optimistic Forecast, Pessimistic Forecast, and Weighted Average Best Forecast. Detailed values for the Comcast stock price can be found in the table below.
Long-term forecasts by years.

Comcast’s Future: From Broadband Connectivity to Streaming Growth
The future of CMCSA stock rates hinges on several critical factors that analysts must consider to make accurate predictions. Central to these are Comcast's strategic shift towards broadband-led connectivity, the burgeoning success of their streaming service Peacock, and their diverse portfolio beyond traditional cable services.
As "cord-cutting" trends accelerate, Comcast’s pivot to high-speed broadband is essential. This strategic shift ensures consistent revenue as demand for internet connectivity soars. In addition, Peacock’s impressive 55% year-over-year growth in paid subscribers highlights a robust new revenue stream, countering the decline in traditional cable TV and aligning with the industry’s digital shift.
Impact of Diverse Ventures and Financial Health
Comcast's ventures, like Universal theme parks and NBCUniversal's broadcast services, play a pivotal role in stabilizing their overall financial health. Successful recovery in these sectors can mitigate potential cable TV declines, providing a broader revenue base. Furthermore, Comcast’s history of 17 consecutive years of dividend growth, an 11.8% 10-year growth rate, and a 3.1% yield make it an attractive option for dividend-focused investors.
- Analysts must watch Comcast’s debt management strategies, given their $95 billion long-term debt. Effective deleveraging, coupled with strong profitability metrics, can inspire investor confidence.
- Additionally, addressing customer service reputation and navigating fierce competition in broadband and streaming sectors remain crucial for sustained growth.
To sum up, these factors collectively influence CMCSA stock prices. By closely monitoring Comcast’s strategic maneuvers and financial health, analysts can make well-informed predictions about the company's stock rate trends.
Review the original Analysis

Comcast Stock Forecast: Balancing Industry Challenges with Strategic Partnerships and Diversification

As analysts eye the CMCSA stock forecast, several key events and factors are poised to significantly impact Comcast's stock rates in the near future. Most prominently, challenges within the cable industry, due to subscriber erosion and competition from streaming services, are expected to affect CMCSA stock prices. However, strategic moves such as the partnership with Starlink, enhancing service capabilities and market reach, and investments in FreeWheel's adtech platform, which can boost ad revenues, cannot be overlooked.
An Analyst's Perspective: Comprehensive Evaluation for Accurate CMCSA Stock Price Prediction
To make the most accurate predictions of CMCSA stock price changes, analysts need to consider these critical factors:
- Challenges in the Cable Industry: Subscriber losses and revenue dips due to industry shifts require close monitoring. These changes are pivotal in shaping the broader CMCSA stock forecast and price target.
- Strategic Partnerships: Collaborations like the one with Starlink enable Comcast to access new customer bases and improve network redundancy. This expansion can drive revenue and positively influence CMCSA stock value.
- Diversified Business Portfolio: Comcast's media, broadband, and theme park businesses offer a buffer against sector-specific headwinds, cushioning the impact on stock prices even when one segment faces challenges.
- Shareholder Distributions: Ongoing stock buybacks and dividend payouts can boost investor confidence. The resulting positive sentiment often leads to higher CMCSA stock prices.
By weighing these factors comprehensively, analysts can formulate a detailed Comcast stock forecast, aiding investors in deciding whether CMCSA is a good stock to buy or sell.
Review the original Analysis
CMCSA Stock Forecast: Navigating the Streaming Wars and Financial Solidity
In the ever-evolving market, CMCSA (Comcast) stock is poised on the brink of potential growth, albeit shadowed by challenges unique to the entertainment industry. Analysts and investors alike are keeping a keen eye on CMCSA's ability to weather the streaming wars and box office doldrums while capitalizing on its robust financial fundamentals. The near future for CMCSA's stock rate is expected to be most influenced by these key events and factors.
Understanding CMCSA's Path to Growth
The tug-of-war between streaming platforms signifies a pivotal challenge, yet also presents an opportunity for Comcast to innovate and adapt. This shifting landscape, coupled with soft box office returns, has cast uncertainty over CMCSA stock forecasts. Investors pondering whether CMCSA stock is a buy or sell must consider these elements. On the flip side, Comcast's well-established foundation of consistent and reliable free cash flow per share underscores a compelling reason why CMCSA could be considered a good stock to buy.
To make the most accurate predictions on CMCSA stock price prediction, analysts meticulously factor in:
- The intensifying streaming wars and their impact on both cable and box office revenues.
- The potential for earnings growth amidst these challenges, with a projected increase in EPS signaling resilience and adaptability.
- The company's valuation metrics, presenting a lucrative case for those seeking undervalued opportunities in a tumultuous market.
- Comcast's stronghold of free cash flow that promises financial stability and the prospect for continued investments or shareholder returns.
An in-depth analysis of these elements, combined with Comcast's strategic maneuvers in response to industry pressures, can guide analysts to predict future movements in CMCSA's stock price with a greater degree of accuracy. Whether viewed as a stock to buy or sell, CMCSA demands attention for its potential to outperform in a sector that's constantly adapting.
Review the original Analysis
Comcast Corporation, a prominent cable and satellite provider, has been enjoying a rising trend in 2023. This momentum is due to healthy cash flows and impressive broadband metrics that consecutively exceeded both top and bottom line earnings expectations, along with smart technology investments. The company managed to outdo its rivals AT&T and Verizon by increasing its broadband market share. Additionally, Comcast boasts 13 successive years of dividend payments and five years of dividend growth. It also has a payout ratio close to 30%, signifying immense profitability.
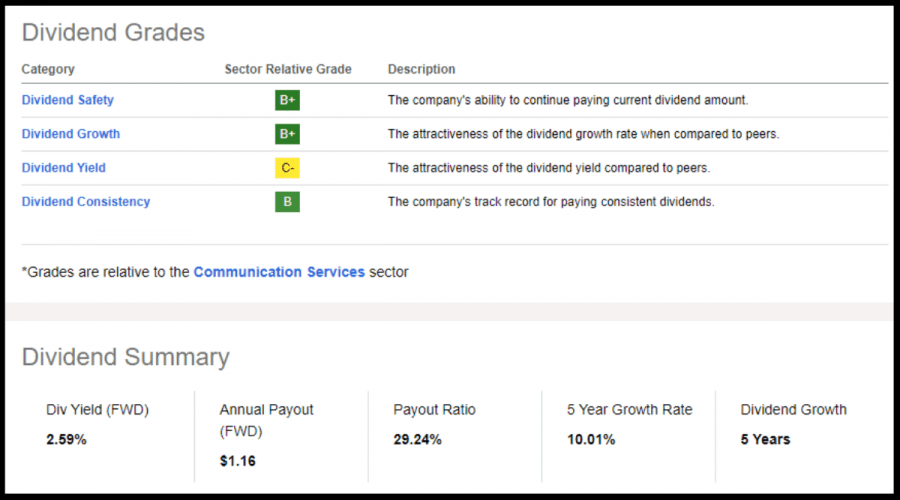
Despite its success, Comcast’s stock is surprisingly affordable as it carries a C- grade valuation. The forward Non-GAAP P/E ratio stands at just 11.85x, notably lower than the sector average of 14.60x. Likewise, its forward PEG ratio is down by 32%. Over the past three months, as many as 22 Wall Street analysts have tweaked their forecasts upwards. Furthermore, Comcast’s sturdy balance sheet which ranks among the best amid its primary competitors backs up its stable dividend safety grade. In light of these factors, investing in Comcast might be considered an effortless and straightforward option.

Comcast daily forecast for a month
| Date | Target | Pes. | Opt. | Vol., % |
|---|---|---|---|---|
| Jul 28 | 39.65 | 39.48 | 40.02 | 1.37 |
| Jul 29 | 39.99 | 39.43 | 40.52 | 2.78 |
| Jul 30 | 39.54 | 39.00 | 39.83 | 2.13 |
| Jul 31 | 39.61 | 39.32 | 40.02 | 1.77 |
| Aug 01 | 39.74 | 39.24 | 40.24 | 2.55 |
| Aug 02 | 39.78 | 39.35 | 39.98 | 1.60 |
| Aug 03 | 39.55 | 38.93 | 40.04 | 2.87 |
| Aug 04 | 39.20 | 39.03 | 39.47 | 1.12 |
| Aug 05 | 39.43 | 39.08 | 40.00 | 2.36 |
| Aug 06 | 39.12 | 38.65 | 39.62 | 2.53 |
| Aug 07 | 39.48 | 38.96 | 39.96 | 2.57 |
| Aug 08 | 39.81 | 39.17 | 40.20 | 2.62 |
| Aug 09 | 40.04 | 39.73 | 40.45 | 1.79 |
| Aug 10 | 40.50 | 40.12 | 40.68 | 1.39 |
| Aug 11 | 40.31 | 40.00 | 40.67 | 1.67 |
| Aug 12 | 40.62 | 40.39 | 40.97 | 1.45 |
| Aug 13 | 41.12 | 40.51 | 41.51 | 2.48 |
| Aug 14 | 41.74 | 41.38 | 42.36 | 2.36 |
| Aug 15 | 41.28 | 40.62 | 41.90 | 3.15 |
| Aug 16 | 40.89 | 40.24 | 41.25 | 2.50 |
| Aug 17 | 41.02 | 40.85 | 41.28 | 1.06 |
| Aug 18 | 40.38 | 40.03 | 40.59 | 1.39 |
| Aug 19 | 40.86 | 40.64 | 41.34 | 1.73 |
| Aug 20 | 40.68 | 40.29 | 40.93 | 1.60 |
| Aug 21 | 40.38 | 39.84 | 40.57 | 1.82 |
| Aug 22 | 40.22 | 39.92 | 40.62 | 1.73 |
| Aug 23 | 40.10 | 39.88 | 40.59 | 1.79 |
| Aug 24 | 40.38 | 39.98 | 40.87 | 2.24 |
| Aug 25 | 39.74 | 39.26 | 39.94 | 1.74 |
| Aug 26 | 39.33 | 38.98 | 39.53 | 1.43 |
Comcast Daily Price Targets
Comcast Stock Forecast 07-28-2024.
Forecast target price for 07-28-2024: $39.65.
Positive dynamics for Comcast shares will prevail with possible volatility of 1.348%.
Pessimistic target level: 39.48
Optimistic target level: 40.02
Comcast Stock Forecast 07-29-2024.
Forecast target price for 07-29-2024: $39.99.
Positive dynamics for Comcast shares will prevail with possible volatility of 2.704%.
Pessimistic target level: 39.43
Optimistic target level: 40.52
Comcast Stock Forecast 07-30-2024.
Forecast target price for 07-30-2024: $39.54.
Negative dynamics for Comcast shares will prevail with possible volatility of 2.085%.
Pessimistic target level: 39.00
Optimistic target level: 39.83
Comcast Stock Forecast 07-31-2024.
Forecast target price for 07-31-2024: $39.61.
Positive dynamics for Comcast shares will prevail with possible volatility of 1.742%.
Pessimistic target level: 39.32
Optimistic target level: 40.02
Comcast Stock Forecast 08-01-2024.
Forecast target price for 08-01-2024: $39.74.
Positive dynamics for Comcast shares will prevail with possible volatility of 2.488%.
Pessimistic target level: 39.24
Optimistic target level: 40.24
Comcast Stock Forecast 08-02-2024.
Forecast target price for 08-02-2024: $39.78.
Positive dynamics for Comcast shares will prevail with possible volatility of 1.572%.
Pessimistic target level: 39.35
Optimistic target level: 39.98
CMCSA (CMCSA) Monthly Stock Prediction for 2024
| Month | Target | Pes. | Opt. | Vol., % |
|---|---|---|---|---|
| Aug. | 38.76 | 36.28 | 40.84 | 11.16 |
| Sep. | 38.70 | 36.96 | 40.52 | 8.79 |
| Oct. | 38.67 | 37.34 | 40.65 | 8.14 |
| Nov. | 36.59 | 35.92 | 37.74 | 4.81 |
| Dec. | 36.45 | 35.72 | 37.99 | 5.99 |
Comcast forecast for this year
Comcast Stock Prediction for Aug 2024
An uptrend is forecast for this month with an optimal target price of $38.7604. Pessimistic: $36.28. Optimistic: $40.84
Comcast Stock Prediction for Sep 2024
An downtrend is forecast for this month with an optimal target price of $38.6984. Pessimistic: $36.96. Optimistic: $40.52
Comcast Stock Prediction for Oct 2024
An downtrend is forecast for this month with an optimal target price of $38.6674. Pessimistic: $37.34. Optimistic: $40.65
Comcast Stock Prediction for Nov 2024
An downtrend is forecast for this month with an optimal target price of $36.5948. Pessimistic: $35.92. Optimistic: $37.74
Comcast Stock Prediction for Dec 2024
An downtrend is forecast for this month with an optimal target price of $36.4485. Pessimistic: $35.72. Optimistic: $37.99
Comcast (CMCSA) Monthly Stock Prediction for 2025
| Month | Target | Pes. | Opt. | Vol., % |
|---|---|---|---|---|
| Jan | 38.46 | 37.72 | 40.06 | 5.84 |
| Feb | 37.54 | 35.68 | 39.34 | 9.31 |
| Mar | 39.04 | 36.85 | 39.91 | 7.67 |
| Apr | 39.07 | 37.94 | 40.73 | 6.83 |
| May | 38.88 | 38.01 | 40.13 | 5.27 |
| Jun | 39.44 | 38.65 | 40.11 | 3.62 |
| Jul | 39.03 | 37.88 | 41.16 | 7.97 |
| Aug | 40.56 | 39.43 | 42.96 | 8.23 |
| Sep | 41.99 | 39.37 | 44.38 | 11.28 |
| Oct | 41.42 | 40.16 | 42.55 | 5.61 |
| Nov | 40.62 | 38.22 | 41.60 | 8.12 |
| Dec | 40.92 | 38.46 | 42.36 | 9.20 |
Comcast (CMCSA) Monthly Stock Prediction for 2026
| Month | Target | Pes. | Opt. | Vol., % |
|---|---|---|---|---|
| Jan | 44.09 | 42.61 | 44.97 | 5.25 |
| Feb | 46.70 | 43.75 | 48.16 | 9.15 |
| Mar | 46.48 | 45.25 | 49.27 | 8.15 |
| Apr | 44.62 | 42.44 | 45.87 | 7.47 |
| May | 44.87 | 42.18 | 47.09 | 10.44 |
| Jun | 41.75 | 40.88 | 42.51 | 3.85 |
| Jul | 41.81 | 39.87 | 43.99 | 9.35 |
| Aug | 42.88 | 40.96 | 44.67 | 8.30 |
| Sep | 44.49 | 42.82 | 46.74 | 8.38 |
| Oct | 45.10 | 43.15 | 47.26 | 8.70 |
| Nov | 42.54 | 39.95 | 44.27 | 9.76 |
| Dec | 42.98 | 41.91 | 44.42 | 5.65 |
Comcast (CMCSA) Monthly Stock Prediction for 2027
| Month | Target | Pes. | Opt. | Vol., % |
|---|---|---|---|---|
| Jan | 43.29 | 40.94 | 44.33 | 7.66 |
| Feb | 43.98 | 42.19 | 46.66 | 9.58 |
| Mar | 43.95 | 41.91 | 44.83 | 6.51 |
| Apr | 44.19 | 41.37 | 46.67 | 11.36 |
| May | 43.91 | 43.14 | 45.46 | 5.10 |
| Jun | 46.12 | 43.65 | 47.78 | 8.65 |
| Jul | 46.86 | 44.20 | 47.80 | 7.53 |
| Aug | 46.71 | 43.98 | 49.29 | 10.77 |
| Sep | 49.33 | 48.38 | 51.54 | 6.13 |
| Oct | 47.39 | 46.45 | 50.31 | 7.69 |
| Nov | 47.62 | 44.69 | 49.95 | 10.53 |
| Dec | 45.95 | 44.62 | 48.30 | 7.61 |
Comcast (CMCSA) Monthly Stock Prediction for 2028
| Month | Target | Pes. | Opt. | Vol., % |
|---|---|---|---|---|
| Jan | 47.78 | 45.34 | 49.92 | 9.19 |
| Feb | 47.94 | 46.13 | 49.16 | 6.16 |
| Mar | 48.82 | 46.51 | 50.97 | 8.74 |
| Apr | 52.18 | 49.51 | 54.77 | 9.60 |
| May | 50.30 | 48.49 | 51.18 | 5.27 |
| Jun | 51.87 | 48.67 | 54.27 | 10.32 |
| Jul | 50.42 | 48.92 | 51.55 | 5.09 |
| Aug | 51.79 | 50.88 | 53.90 | 5.61 |
| Sep | 55.39 | 53.71 | 56.85 | 5.53 |
| Oct | 56.45 | 53.52 | 57.85 | 7.49 |
| Nov | 52.66 | 49.96 | 55.99 | 10.76 |
| Dec | 51.90 | 49.74 | 53.27 | 6.63 |
Comcast information and performance
ONE COMCAST CENTER, PHILADELPHIA, PA, US
Market capitalization of the Comcast Corp. is the total market value of all issued shares of a company. It is calculated by the formula multiplying the number of CMCSA shares in the company outstanding by the market price of one share.
EBITDA of Comcast is earnings before interest, income tax and depreciation of assets.
P/E ratio (price to earnings) - shows the ratio between the price of a share and the company's profit
Price/earnings to growth
Dividend Per Share is a financial indicator equal to the ratio of the company's net profit available for distribution to the annual average of ordinary shares.
Dividend yield is a ratio that shows how much a company pays in dividends each year at the stock price.
EPS shows how much of the net profit is accounted for by the common share.
Trailing P/E depends on what has already been done. It uses the current share price and divides it by the total earnings per share for the last 12 months.
Forward P/E uses projections of future earnings instead of final numbers.
Enterprise Value (EV) /Revenue
The EV / EBITDA ratio shows the ratio of the cost (EV) to its profit before tax, interest and amortization (EBITDA).
Number of issued ordinary shares
Number of freely tradable shares
Shares Short Prior Month - the number of shares in short positions in the last month.
Comcast (CMCSA) stock dividend
Comcast last paid dividends on 10/02/2024. The next scheduled payment will be on 07/24/2024. The amount of dividends is $0.58 per share. If the date of the next dividend payment has not been updated, it means that the issuer has not yet announced the exact payment. As soon as information becomes available, we will immediately update the data. Bookmark our portal to stay updated.
Last Split Date: 01/01/1970
Splitting of shares is an increase in the number of securities of the issuing company circulating on the market due to a decrease in their value at constant capitalization.
For example, a 5: 1 ratio means that the value of one share will decrease 5 times, the total amount will increase 5 times. It is important to understand that this procedure does not change the capitalization of the company, as well as the total value of assets held in private hands.
Related stocks from Communication services sector


