


September 8, 2024 S&P 500 In Freefall: Is This The End Of The Bull Market?
September 6, 2024 Jobs Report Spotlight As Fed Weighs Rate Cut Decision
August 26, 2024 NVDA Earnings Report Insights
August 22, 2024 Massive U.S. Job Growth Revision Shakes Economy And Markets

Nvidia: The Blackwell Delay And Its Consequences


Nvidia Q2 Offers Several Clues To Sustainable Growth Ahead

The Power Of Expectations: Nvidia’s Earnings And The Market Reaction


April 23, 2024 Maximizing Profits: When is the Right Time to Sell Your Business?

April 12, 2024 Improve Your Financial Status: A How-To Guide
April 12, 2024 How ZIM Integrated Container Tracking is Revolutionizing Global Trade

March 15, 2024 6 Best Growth Stocks To Buy Now According to Metatrader 5

AT&T (T) Stock Forecast for 2024, 2025, 2026. Sell or Buy?
Updated: September 8, 2024 (02:18)
Sector: Communication servicesThe share price of AT&T Inc. (T) now
News Impact Analyzer
Full report|
This Week
|
Bullish | Impact: 2.14 | News: 3 (2/0/1) |
|
Previous Week
|
Na | Impact: Na | News: Na |
|
Two Weeks Ago
|
Bearish | Impact: 5 | News: 1 |
|
Three Weeks Ago
|
Na | Impact: Na | News: Na |
Analysts predictions
Full report|
This Week
|
Bullish | Opinions: 1 (1/0/0) |
|
Previous Week
|
Bullish | Opinions: 2 (2/0/0) |
|
Two Weeks Ago
|
Neutral | Opinions: 3 (1/1/1) |
|
Three Weeks Ago
|
Neutral | Opinions: Na |
Analyzing the Most Important T news

Verizon-Frontier Acquisition Talks Shake Up Telecom Stocks


AST SpaceMobile Surges Over 7% on September Satellite Launch Confirmation


Nokia Partners with AT&T to Expand Fiber Network with U.S.-Made Tech
Historical and forecast chart of AT&T stock
The chart below shows the historical price of AT&T stock and a prediction chart for the next month. For convenience, prices are divided by color. Forecast prices include: Optimistic Forecast, Pessimistic Forecast, and Weighted Average Best Forecast. Detailed values for the AT&T stock price can be found in the table below.
Long-term forecasts by years.
AT&T Inc. Analysts predictions review

As of now, Panda has combed through 6 analytical articles which are directly related to T from the last 30 days. Out of these, 4 clearly showcase a bullish trend, while 1 see a bearish trend as the more likely scenario, and 1 stay neutral.
To identify the dominant trend, we took into account analytical articles from the past 30 days, spanning from Aug 19, 2024 to Sep 02, 2024.

AT&T's Strategic Pivot: Cash Flow Growth and 5G Propel Strong Bullish Trend

In this review, we delve into the analytically driven financial article authored by Long Player, who has cultivated a strong reputation within the financial community. Demonstrating an unwaveringly Strong Bullish stance on T stock, Long Player brings a wealth of expertise to the table. With an impressive repertoire of 2054 publications since joining in 2015 and a solid subscriber base of 22,265, the author’s insights are both widely read and highly regarded. The prolific output and sustained contribution underline the reliability and depth of Long Player’s analysis, making this review an essential read for those interested in the financial dynamics surrounding T stock.
Key Theses of the Article
- AT&T has a new cash flow pattern post-divestiture that is underappreciated.
- The company is in a transition phase with 5G expected to predominate eventually.
- Management can boost EBITDA and free cash flow growth faster than the business in the short term.
- A positive reaction to second-quarter cash flow results indicates low market expectations.
- Debt levels are a concern, but there is progress towards reducing debt.
- The growth areas are expanding while legacy business shrink, promising long-term growth.
- The company’s business focusing strategy is resulting in consistent returns with potential for a stock price revaluation.
Factors Influencing AT&T's Stock Price
New Cash Flow Pattern
The pattern shows seasonality which, combined with low market expectations, could lead to share price appreciation in quarterly announcements.
Transition to 5G
The shift to 5G represents future growth potential, although it is presently offset by the decline in older segments like landline services.
Management Focus on EBITDA and Free Cash Flow
A focused strategy on boosting EBITDA and free cash flow can provide greater returns in the short term, propelling stock performance.
Market Reaction to Cash Flow Announcements
Positive market reactions to cash flow announcements following low expectations could lead to periodic boosts in stock price.
Debt Levels and Debt Repayment
Concerns about debt levels remain, but steady progress in debt reduction provides reassurance to investors, though with minimal immediate stock price impact.
Growth in Consumer Segments and Cell Phone Business
Steady growth in consumer-focused segments and cell phone businesses counters the decline in legacy services, improving future revenue streams.
Dividend Yield
A robust dividend yield offers guaranteed returns which can make the stock attractive to income investors, contributing to stock price stability.
Review the original Analysis
AT&T: Unlocking Value Through Total Shareholder Yield and Debt Reduction
Envision Research, a prolific contributor since 2021 with 1055 publications, is known for delivering authoritative and widely-followed financial insights, evidenced by 15699 dedicated subscribers. With their well-established credibility, Envision Research provides deeply analyzed perspectives on various stocks, garnering a high reputation among readers. In their latest analytical piece, Envision Research maintains a bullish stance on T stock, articulating a confident forecast for its performance. Given the author's high volume of quality content in a relatively short period, their viewpoint carries significant weight. This review delves into the underpinning arguments and data supporting this optimistic outlook for T stock.
Key Theses of the Analytical Review
- AT&T's high dividend yield (5.6%) understates its upside potential.
- Total Shareholder Yield (TSY) includes share buybacks and debt paydowns, not just dividends.
- Repurchasing shares at discounted valuations benefits staying shareholders.
- Debt repayment has significantly reduced AT&T's liabilities and improved its attractiveness.
Key Factors Influencing AT&T's Stock Price
Dividend Yield
The high dividend yield is attractive to investors seeking stable income, but it also highlights the need to look at total shareholder yield. This yield provides a more comprehensive view of capital returns.
Share Buybacks
Share buybacks conducted at a valuation discount effectively transfer wealth from selling shareholders to staying shareholders. This action enhances shareholder value by reducing the number of shares outstanding.
Debt Repayment
AT&T's aggressive debt repayment has reduced its total liabilities from over $367 billion in December 2021 to $276 billion by March 2024. Lower debt levels decrease financial risk and improve the company's creditworthiness.
Valuation Metrics
AT&T's EV-based valuation metrics are below sector medians, making the stock appear undervalued. For instance, its FWD EV/EBIT ratio is 12.66x compared to the sector median of 15.15x, representing a 14.47% discount.
CAPEX and Fiber Network Growth
Stabilization of CAPEX and growth in its fiber network could drive future earnings growth. This capital expenditure supports long-term scalability and profitability.
Risk Factors
Regulatory risks, competition, and heavy CAPEX requirements could pressure AT&T's financials. For example, environmental regulatory investigations into the company's legacy cables pose potential financial liabilities.
Review the original Analysis Commentary
AT&T's current strategies illuminate a promising outlook for its investors. The company’s high dividend yield of 5.6% is just the tip of the iceberg, as the broader lens of Total Shareholder Yield (TSY)—encompassing share buybacks and debt paydowns—paints a more comprehensive and favorable picture. With significant debt reduction from $367 billion to $276 billion and undervalued valuation metrics, AT&T appears to be in a stronger financial position. These efforts not only enhance investor value but also improve the company’s creditworthiness and reduce financial risks. In the next 15 days, we estimate an average influence strength of around 7.4 out of 10 on stock trends, driven mainly by the high-impact factors.
Looking into the next month, the continued focus on share buybacks could further bolster investor confidence, increasing the factor's influence strength to almost 8 out of 10. Meanwhile, the stabilization of CAPEX and expansion of the fiber network primes AT&T for long-term growth and profitability. Despite some regulatory and competitive risks, these positives collectively suggest a bullish trend for AT&T's stock in the near term.
Comprehensive Analysis of AT&T (T) Stock Market Performance
Our multifaceted analysis of AT&T's stock market is grounded in the company's key news stories, insights from reputable analysts, as well as mathematical and technical evaluations. Taking into account assessments from each of these aspects in real-time helps us address the most crucial questions for investors in the most objective way possible:
- When should I take profit in AT&T stock?
- When should I record a loss on AT&T stock?
- What are analysts' forecasts for AT&T stock?
- What is the future of AT&T stock?
We forecast AT&T stock performance using neural networks based on historical data on AT&T stocks.
AT&T Inc. News influencing stock rates

As of now, Panda has combed through 4 news items directly related to T from the last 30 days. Out of these, 2 clearly showcase a bullish trend, while 2 display bearish tendencies, and 0 events are neutral.
The strength of the bearish trend is roughly equivalent to the bullish sentiment, indicating a certain current stability in stock prices when based on news background analysis.
The news analyzed fell within the period from Aug 18, 2024, to Sep 04, 2024.
Majority of Fortune 500 Companies List AI as Emerging Risk

AT&T Soars Amid Strong Cash Flow and Subscriber Growth

Market Movers: Tesla Dips, AT&T Soars Amid Strong Q2 Performance

AT&T Surpasses Subscriber Projections, Boosts Free Cash Flow to $4.6B

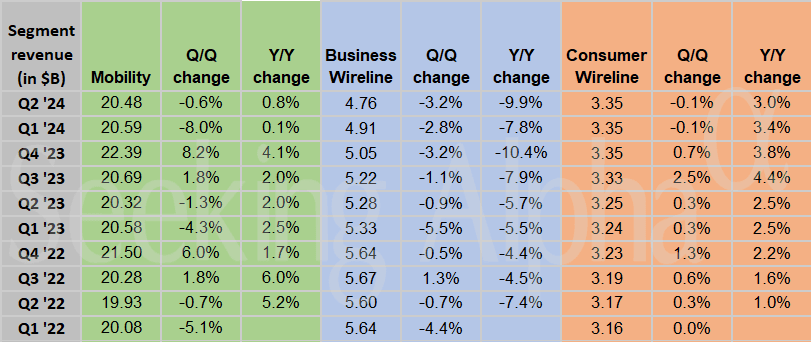
AT&T Q2 Performance: Steady Boost in Mobility Subscribers, ARPU, and Net Adds
AT&T's Q2: Mixed Results, FY2024 Guidance Holds Steady

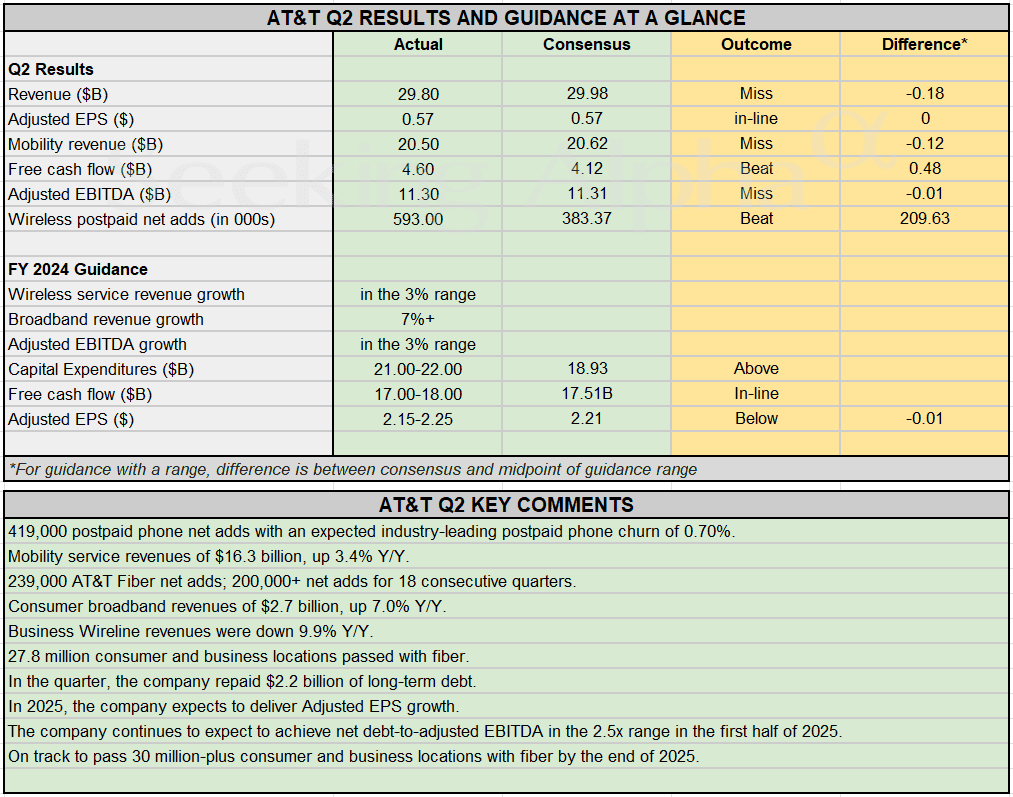
AT&T Q2 Results: EPS Meets Expectations but Revenue Misses Mark

Financials Shine in Q2 While Wall Street Faces Tech Woes – Earnings Impact

AT&T and Verizon Clash Over FirstNet 5G Expansion for Public Safety

AT&T Inc. Is a telecommunications holding that provides services such as local and long distance telephone communications, wireless communications and data transmission, Internet access and messaging, IP and satellite television, security systems, telecommunications equipment, advertising in reference publications and publishing services.

AT&T daily forecast for a month
| Date | Target | Pes. | Opt. | Vol., % |
|---|---|---|---|---|
| Sep 09 | 21.11 | 20.99 | 21.19 | 0.95 |
| Sep 10 | 21.19 | 21.13 | 21.26 | 0.62 |
| Sep 11 | 21.06 | 20.96 | 21.22 | 1.21 |
| Sep 12 | 20.89 | 20.73 | 21.02 | 1.42 |
| Sep 13 | 20.84 | 20.77 | 20.97 | 0.94 |
| Sep 14 | 20.87 | 20.75 | 21.03 | 1.35 |
| Sep 15 | 20.91 | 20.76 | 21.06 | 1.45 |
| Sep 16 | 20.93 | 20.85 | 21.05 | 0.96 |
| Sep 17 | 21.01 | 20.84 | 21.13 | 1.39 |
| Sep 18 | 20.99 | 20.94 | 21.10 | 0.78 |
| Sep 19 | 21.02 | 20.89 | 21.07 | 0.84 |
| Sep 20 | 21.14 | 21.08 | 21.26 | 0.85 |
| Sep 21 | 21.29 | 21.16 | 21.35 | 0.90 |
| Sep 22 | 21.42 | 21.32 | 21.57 | 1.16 |
| Sep 23 | 21.45 | 21.39 | 21.63 | 1.09 |
| Sep 24 | 21.46 | 21.33 | 21.62 | 1.33 |
| Sep 25 | 21.38 | 21.23 | 21.47 | 1.13 |
| Sep 26 | 21.31 | 21.16 | 21.36 | 0.94 |
| Sep 27 | 21.33 | 21.28 | 21.45 | 0.82 |
| Sep 28 | 21.12 | 20.95 | 21.22 | 1.28 |
| Sep 29 | 21.20 | 21.10 | 21.25 | 0.75 |
| Sep 30 | 21.29 | 21.15 | 21.36 | 1.03 |
| Oct 01 | 21.44 | 21.39 | 21.53 | 0.66 |
| Oct 02 | 21.57 | 21.40 | 21.63 | 1.11 |
| Oct 03 | 21.48 | 21.39 | 21.60 | 0.98 |
| Oct 04 | 21.60 | 21.51 | 21.74 | 1.04 |
| Oct 05 | 21.52 | 21.40 | 21.64 | 1.11 |
| Oct 06 | 21.34 | 21.29 | 21.41 | 0.58 |
| Oct 07 | 21.30 | 21.23 | 21.46 | 1.08 |
| Oct 08 | 21.22 | 21.10 | 21.36 | 1.23 |
AT&T Daily Price Targets
AT&T Stock Forecast 09-09-2024.
Forecast target price for 09-09-2024: $21.11.
Positive dynamics for AT&T shares will prevail with possible volatility of 0.936%.
Pessimistic target level: 20.99
Optimistic target level: 21.19
AT&T Stock Forecast 09-10-2024.
Forecast target price for 09-10-2024: $21.19.
Positive dynamics for AT&T shares will prevail with possible volatility of 0.618%.
Pessimistic target level: 21.13
Optimistic target level: 21.26
AT&T Stock Forecast 09-11-2024.
Forecast target price for 09-11-2024: $21.06.
Negative dynamics for AT&T shares will prevail with possible volatility of 1.191%.
Pessimistic target level: 20.96
Optimistic target level: 21.22
AT&T Stock Forecast 09-12-2024.
Forecast target price for 09-12-2024: $20.89.
Negative dynamics for AT&T shares will prevail with possible volatility of 1.401%.
Pessimistic target level: 20.73
Optimistic target level: 21.02
AT&T Stock Forecast 09-13-2024.
Forecast target price for 09-13-2024: $20.84.
Negative dynamics for AT&T shares will prevail with possible volatility of 0.934%.
Pessimistic target level: 20.77
Optimistic target level: 20.97
AT&T Stock Forecast 09-14-2024.
Forecast target price for 09-14-2024: $20.87.
Positive dynamics for AT&T shares will prevail with possible volatility of 1.330%.
Pessimistic target level: 20.75
Optimistic target level: 21.03
T (T) Monthly Stock Prediction for 2024
| Month | Target | Pes. | Opt. | Vol., % |
|---|---|---|---|---|
| Oct. | 21.07 | 20.73 | 22.04 | 5.96 |
| Nov. | 21.74 | 21.14 | 22.28 | 5.09 |
| Dec. | 22.18 | 21.76 | 22.57 | 3.60 |
AT&T forecast for this year
AT&T Stock Prediction for Oct 2024
An uptrend is forecast for this month with an optimal target price of $21.0707. Pessimistic: $20.73. Optimistic: $22.04
AT&T Stock Prediction for Nov 2024
An uptrend is forecast for this month with an optimal target price of $21.7407. Pessimistic: $21.14. Optimistic: $22.28
AT&T Stock Prediction for Dec 2024
An uptrend is forecast for this month with an optimal target price of $22.1842. Pessimistic: $21.76. Optimistic: $22.57
AT&T (T) Monthly Stock Prediction for 2025
| Month | Target | Pes. | Opt. | Vol., % |
|---|---|---|---|---|
| Jan | 21.11 | 20.73 | 22.08 | 6.14 |
| Feb | 21.03 | 20.59 | 21.91 | 6.05 |
| Mar | 20.61 | 19.90 | 21.36 | 6.83 |
| Apr | 20.56 | 19.87 | 21.01 | 5.40 |
| May | 20.72 | 19.92 | 21.55 | 7.56 |
| Jun | 20.59 | 19.97 | 21.34 | 6.42 |
| Jul | 21.29 | 20.47 | 22.12 | 7.45 |
| Aug | 20.55 | 19.76 | 21.18 | 6.70 |
| Sep | 20.19 | 19.43 | 21.02 | 7.55 |
| Oct | 20.01 | 19.30 | 20.35 | 5.13 |
| Nov | 20.42 | 19.84 | 21.30 | 6.84 |
| Dec | 20.53 | 20.12 | 20.90 | 3.71 |
AT&T (T) Monthly Stock Prediction for 2026
| Month | Target | Pes. | Opt. | Vol., % |
|---|---|---|---|---|
| Jan | 20.33 | 19.61 | 20.81 | 5.75 |
| Feb | 20.38 | 19.54 | 20.92 | 6.61 |
| Mar | 20.71 | 20.07 | 21.57 | 6.97 |
| Apr | 21.18 | 20.32 | 21.99 | 7.57 |
| May | 20.23 | 19.38 | 20.52 | 5.56 |
| Jun | 20.51 | 19.70 | 20.78 | 5.21 |
| Jul | 20.09 | 19.84 | 20.48 | 3.12 |
| Aug | 18.99 | 18.22 | 19.26 | 5.39 |
| Sep | 19.97 | 19.70 | 20.21 | 2.55 |
| Oct | 21.09 | 20.42 | 21.90 | 6.76 |
| Nov | 22.19 | 21.19 | 22.95 | 7.66 |
| Dec | 23.32 | 22.78 | 23.77 | 4.18 |
AT&T information and performance
208 S. AKARD ST, ATTN : JAMES LACY, DALLAS, TX, US
Market capitalization of the AT&T Inc. is the total market value of all issued shares of a company. It is calculated by the formula multiplying the number of T shares in the company outstanding by the market price of one share.
EBITDA of AT&T is earnings before interest, income tax and depreciation of assets.
P/E ratio (price to earnings) - shows the ratio between the price of a share and the company's profit
Price/earnings to growth
Dividend Per Share is a financial indicator equal to the ratio of the company's net profit available for distribution to the annual average of ordinary shares.
Dividend yield is a ratio that shows how much a company pays in dividends each year at the stock price.
EPS shows how much of the net profit is accounted for by the common share.
Trailing P/E depends on what has already been done. It uses the current share price and divides it by the total earnings per share for the last 12 months.
Forward P/E uses projections of future earnings instead of final numbers.
Enterprise Value (EV) /Revenue
The EV / EBITDA ratio shows the ratio of the cost (EV) to its profit before tax, interest and amortization (EBITDA).
Number of issued ordinary shares
Number of freely tradable shares
Shares Short Prior Month - the number of shares in short positions in the last month.
AT&T (T) stock dividend
AT&T last paid dividends on 07/10/2024. The next scheduled payment will be on 08/01/2024. The amount of dividends is $1.11 per share. If the date of the next dividend payment has not been updated, it means that the issuer has not yet announced the exact payment. As soon as information becomes available, we will immediately update the data. Bookmark our portal to stay updated.
Last Split Date: 01/01/1970
Splitting of shares is an increase in the number of securities of the issuing company circulating on the market due to a decrease in their value at constant capitalization.
For example, a 5: 1 ratio means that the value of one share will decrease 5 times, the total amount will increase 5 times. It is important to understand that this procedure does not change the capitalization of the company, as well as the total value of assets held in private hands.


Commentary
AT&T's new cash flow pattern and its transition to 5G technology are pivotal for the company’s future. Despite the challenges associated with debt levels and legacy business declines, the company’s focus on boosting EBITDA and free cash flow promises short-term gains. Growth in consumer segments and cell phone business strengthens future revenue prospects, which, combined with the positive market reactions to cash flow announcements, creates an appealing investment scenario. On average, these factors signal a substantially positive influence on the stock in the next 15 days.
In the longer term, progress in reducing debt and a robust dividend yield bolster AT&T’s attractiveness to income investors, ensuring stable returns. The company’s strategic focus on high-growth areas and 5G allied with an effective approach to debt repayment, pave the way for potential stock price revaluation. These factors, taken together, point to a strong bullish trend for the stock in the coming month.