


July 14, 2024 This Week Top S&P 500 Gainers & Losers

Tesla Q2: The Bottom Is Likely In


Tesla: Time To Take Profits

Microsoft: The Q4 Results Should Surprise You

Tesla: Optimus And FSD Probably Won’t Save The Day

April 23, 2024 Maximizing Profits: When is the Right Time to Sell Your Business?

April 12, 2024 Improve Your Financial Status: A How-To Guide
April 12, 2024 How ZIM Integrated Container Tracking is Revolutionizing Global Trade

March 15, 2024 6 Best Growth Stocks To Buy Now According to Metatrader 5

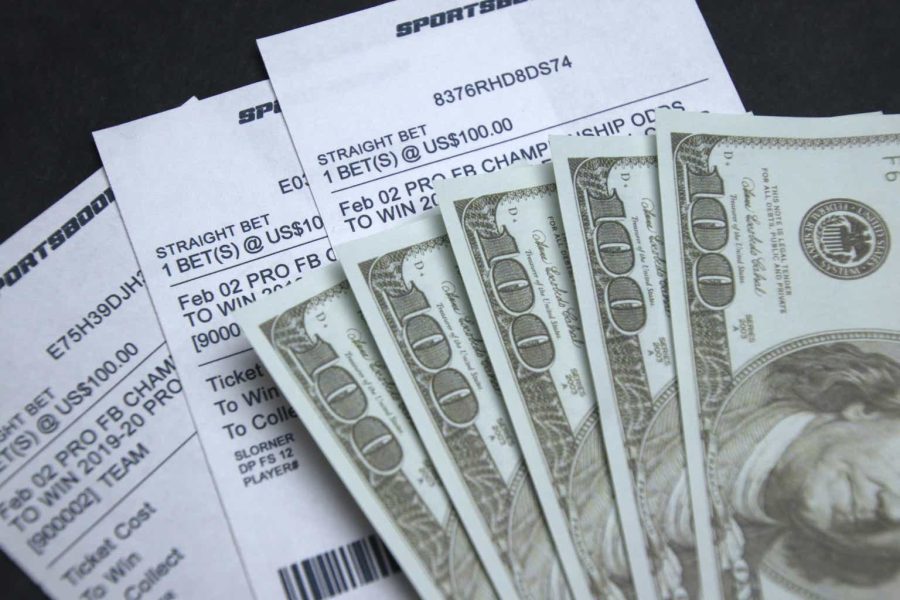
DraftKings (DKNG) Stock Forecast for 2024–2028. Sell or Buy?
Updated: July 27, 2024 (05:04)
Sector: FinancialThe share price of DraftKings Inc. (DKNG) now
50/200 Day Moving Average: $39.16 / $38.6
This figure corresponds to the Average Price over the previous 50/200 days. For DraftKings stocks, the 50-day moving average is the resistance level today.
For DraftKings stocks, the 200-day moving average is the resistance level today.
Are you interested in DraftKings Inc. stocks and want to buy them, or are they already in your portfolio? If yes, then on this page you will find useful information about the dynamics of the DraftKings stock price in 2024, 2025, 2026, 2027, 2028. How much will one DraftKings share be worth in 2024 - 2028?
When should I take profit in DraftKings stock? When should I record a loss on DraftKings stock? What are analysts' forecasts for DraftKings stock? What is the future of DraftKings stock? We forecast DraftKings stock performance using neural networks based on historical data on DraftKings stocks. Also, when forecasting, technical analysis tools are used, world geopolitical and news factors are taken into account.
DraftKings stock prediction results are shown below and presented in the form of graphs, tables and text information, divided into time intervals. (Next month, 2024, 2025, 2026, 2027 and 2028) The final quotes of the instrument at the close of the previous trading day are a signal to adjust the forecasts for DraftKings shares. This happens once a day.
Historical and forecast chart of DraftKings stock
The chart below shows the historical price of DraftKings stock and a prediction chart for the next month. For convenience, prices are divided by color. Forecast prices include: Optimistic Forecast, Pessimistic Forecast, and Weighted Average Best Forecast. Detailed values for the DraftKings stock price can be found in the table below.
Long-term forecasts by years.
DraftKings Stock Forecast: Key Factors Influencing Future Performance

DraftKings Inc. (DKNG) is poised for dynamic changes in its stock rates, driven by several critical factors. As the sports betting market evolves, understanding these elements can help analysts provide more accurate DKNG stock price predictions.
Major Influences on DKNG Stock Prices
One of the most significant factors is DKNG's path to profitability. Analysts expect DKNG to turn profitable by Q3 2024. This milestone is likely to boost investor confidence, resulting in increased demand and potentially driving up the DKNG stock price. Furthermore, market consolidation plays a crucial role. Currently, DKNG and FanDuel dominate more than 70% of the sports betting market share, and further consolidation of fringe sites could cement DKNG’s dominance, leading to greater market share and higher revenues.
Additionally, tax rate increases on sports gambling wins present a notable consideration. While tax hikes may initially raise concerns about profitability, DKNG’s geographical defenses, allowing bettors to travel to neighboring states with lower taxes, can mitigate the impact. Therefore, tax increases are less likely to drastically affect DKNG stock prices.
Finally, growth prospects in new states are exceedingly promising. As more states move toward legalizing sports betting, DKNG stands to benefit by expanding its operations, creating additional revenue streams, and fostering significant future growth.
- Profitability of DKNG: Turning profitable by Q3 2024 can elevate investor confidence.
- Market Consolidation: Further consolidation could amplify DKNG’s market share and revenues.
- Tax Rate Increases: Geographical defenses can buffer the impact.
- Growth in New States: Legalization in new states opens up additional revenue streams.
For accuracy in DKNG stock forecasts, analysts should closely monitor these events and factors. Evaluating the profitability trajectory, market consolidation trends, tax policy changes, and legal developments in new states will provide critical insights into DraftKings stock forecast and DKNG stock price predictions.
Review the original Analysis

Unlocking the Future of DKNG Stock: A Strategic Forecast
In the rapidly evolving sports betting market, DraftKings (DKNG) stands at the forefront, navigating through growth opportunities and potential profitability pathways. Analysts keen on predicting DKNG stock rates are closely monitoring several pivotal events and factors influencing its trajectory. Paramount among these are the US online sports betting market's expected 14% CAGR growth and regulatory shifts, which could either pose challenges or open up new avenues for revenue.
Key Indicators to Watch for Accurate DKNG Predictions
For analysts aiming to nail down the most accurate DKNG stock forecast, understanding the complex interplay between sector growth, competitive dynamics, and regulatory environments becomes essential. DraftKings' battle for market share with FanDuel highlights the intense competition and the oligopolistic nature of the industry. Moreover, DraftKings' innovative approaches to increase the Average Revenue Per Monthly Unique Payer (ARPMUP) and efficiency in scaling operations are critical metrics for assessments.
Additionally, looming regulatory and legal risks, such as potential tax increases on online betting, and promotional restrictions, present factors that need careful consideration. Forecasting the future rates of DKNG stock involves a nuanced analysis of:
- The expanding sports betting market's growth potential
- Competitive positioning within the industry
- Adjustments in market dynamics and industry trends
- The company's pathway to profitability
- Impact of regulatory and legal considerations
Given these considerations, an analyst's toolkit for making a DKNG stock price prediction would involve a blend of market insight, competitive analysis, and regulatory vigilance. DraftKings' current positioning suggests it is undervalued with a potential 42% upside, making it a compelling candidate for the question of "is DKNG a good stock to buy?" With these dynamics at play, DKNG presents an intriguing narrative of risk, reward, and potential in the bustling arena of online sports betting.
Review the original Analysis

Unraveling the Future: Navigating DKNG Stocks with Insightful Predictions

In the dynamic world of stock trading, DraftKings (DKNG) presents a fascinating case for analysts and investors alike, with various factors poised to shape its stock price trajectory. Foremost, the changing tax landscapes, particularly in high-rate states like New York, stand out as a crucial factor, potentially diminishing the company's profitability and, in turn, influencing the DKNG stock forecast. As analysts aim to navigate these turbulent waters, understanding the impact of tax regulations becomes instrumental in making accurate DKNG stock price predictions.
The Pillars of Prediction: Key Indicators to Watch
Furthermore, market consolidation emerges as a double-edged sword. While it heralds a promising horizon for DraftKings by potentially elevating its market position against competitors like FanDuel, the degree of its impact remains intertwined with how effectively DraftKings can capitalize on this trend. Analysts mulling over whether DKNG is a good stock to buy are keenly observing these market dynamics, alongside the looming specter of league fees that could further cut into profits.
Not to be underestimated, technological upgrades represent a subtle yet significant factor. The ability to granulize odds and pricing on a state-by-state basis could offer DraftKings a competitive edge in mitigating tax burdens, thereby affecting DKNG stock price targets. For those wrestling with the decision to buy or sell DraftKings stock, staying attuned to these technological advancements could provide crucial insights.
- Tax rates
- League fees
- Market consolidation
- Technological upgrades
In summary, analysts looking to forge the most accurate DKNG stock price prediction will need to weigh these factors judiciously. Whether considering DKNG stock buy or sell, the confluence of these considerations dictates a multifaceted approach, ensuring that any investment decision in DraftKings is as informed as it is strategic.
Review the original Analysis
DraftKings Inc. operates as a digital sports, entertainment and gaming company in the United States. The company provides users with daily opportunities for sports, sports betting and iGaming. She is also involved in the design and development of sports betting and casino gaming platform software for online and retail bookmakers, as well as casino gaming products. The company distributes its product offerings through a variety of channels, including traditional websites, direct app downloads, and direct-to-consumer digital platforms. DraftK ings Inc. headquartered in Boston, Massachusetts.
DraftKings daily forecast for a month
| Date | Target | Pes. | Opt. | Vol., % |
|---|---|---|---|---|
| Jul 29 | 36.96 | 36.59 | 37.25 | 1.82 |
| Jul 30 | 37.59 | 37.28 | 38.57 | 3.47 |
| Jul 31 | 38.25 | 37.64 | 39.14 | 3.98 |
| Aug 01 | 38.48 | 37.62 | 39.01 | 3.68 |
| Aug 02 | 39.62 | 39.04 | 39.97 | 2.40 |
| Aug 03 | 39.67 | 38.72 | 40.54 | 4.71 |
| Aug 04 | 40.00 | 39.01 | 41.03 | 5.17 |
| Aug 05 | 39.25 | 38.75 | 40.32 | 4.05 |
| Aug 06 | 39.83 | 39.42 | 40.77 | 3.44 |
| Aug 07 | 39.58 | 39.20 | 40.04 | 2.14 |
| Aug 08 | 37.99 | 37.45 | 38.37 | 2.48 |
| Aug 09 | 39.16 | 38.02 | 39.60 | 4.16 |
| Aug 10 | 38.71 | 37.55 | 39.87 | 6.19 |
| Aug 11 | 39.86 | 38.96 | 40.43 | 3.76 |
| Aug 12 | 39.86 | 38.74 | 40.88 | 5.51 |
| Aug 13 | 39.98 | 39.01 | 41.10 | 5.37 |
| Aug 14 | 39.84 | 38.87 | 40.44 | 4.06 |
| Aug 15 | 39.52 | 39.12 | 39.99 | 2.22 |
| Aug 16 | 40.22 | 39.19 | 40.55 | 3.49 |
| Aug 17 | 40.91 | 39.99 | 42.04 | 5.11 |
| Aug 18 | 40.91 | 40.09 | 41.79 | 4.25 |
| Aug 19 | 41.51 | 40.60 | 41.86 | 3.11 |
| Aug 20 | 41.75 | 40.54 | 42.85 | 5.68 |
| Aug 21 | 42.15 | 41.22 | 43.06 | 4.46 |
| Aug 22 | 41.86 | 41.39 | 43.01 | 3.92 |
| Aug 23 | 43.50 | 43.15 | 44.68 | 3.55 |
| Aug 24 | 43.13 | 42.24 | 43.50 | 2.98 |
| Aug 25 | 43.03 | 42.12 | 43.74 | 3.84 |
| Aug 26 | 43.20 | 42.58 | 43.96 | 3.25 |
| Aug 27 | 42.94 | 42.43 | 44.20 | 4.17 |
DraftKings Daily Price Targets
DraftKings Stock Forecast 07-29-2024.
Forecast target price for 07-29-2024: $36.96.
Positive dynamics for DraftKings shares will prevail with possible volatility of 1.786%.
Pessimistic target level: 36.59
Optimistic target level: 37.25
DraftKings Stock Forecast 07-30-2024.
Forecast target price for 07-30-2024: $37.59.
Positive dynamics for DraftKings shares will prevail with possible volatility of 3.353%.
Pessimistic target level: 37.28
Optimistic target level: 38.57
DraftKings Stock Forecast 07-31-2024.
Forecast target price for 07-31-2024: $38.25.
Positive dynamics for DraftKings shares will prevail with possible volatility of 3.831%.
Pessimistic target level: 37.64
Optimistic target level: 39.14
DraftKings Stock Forecast 08-01-2024.
Forecast target price for 08-01-2024: $38.48.
Positive dynamics for DraftKings shares will prevail with possible volatility of 3.552%.
Pessimistic target level: 37.62
Optimistic target level: 39.01
DraftKings Stock Forecast 08-02-2024.
Forecast target price for 08-02-2024: $39.62.
Positive dynamics for DraftKings shares will prevail with possible volatility of 2.339%.
Pessimistic target level: 39.04
Optimistic target level: 39.97
DraftKings Stock Forecast 08-03-2024.
Forecast target price for 08-03-2024: $39.67.
Positive dynamics for DraftKings shares will prevail with possible volatility of 4.501%.
Pessimistic target level: 38.72
Optimistic target level: 40.54
DKNG (DKNG) Monthly Stock Prediction for 2024
| Month | Target | Pes. | Opt. | Vol., % |
|---|---|---|---|---|
| Aug. | 37.99 | 36.90 | 39.54 | 6.66 |
| Sep. | 37.41 | 34.36 | 38.31 | 10.31 |
| Oct. | 35.59 | 32.54 | 36.77 | 11.50 |
| Nov. | 36.34 | 34.90 | 38.82 | 10.09 |
| Dec. | 34.14 | 31.47 | 35.53 | 11.42 |
DraftKings forecast for this year
DraftKings Stock Prediction for Aug 2024
An uptrend is forecast for this month with an optimal target price of $37.9901. Pessimistic: $36.90. Optimistic: $39.54
DraftKings Stock Prediction for Sep 2024
An downtrend is forecast for this month with an optimal target price of $37.405. Pessimistic: $34.36. Optimistic: $38.31
DraftKings Stock Prediction for Oct 2024
An downtrend is forecast for this month with an optimal target price of $35.5946. Pessimistic: $32.54. Optimistic: $36.77
DraftKings Stock Prediction for Nov 2024
An uptrend is forecast for this month with an optimal target price of $36.3386. Pessimistic: $34.90. Optimistic: $38.82
DraftKings Stock Prediction for Dec 2024
An downtrend is forecast for this month with an optimal target price of $34.1401. Pessimistic: $31.47. Optimistic: $35.53
DraftKings (DKNG) Monthly Stock Prediction for 2025
| Month | Target | Pes. | Opt. | Vol., % |
|---|---|---|---|---|
| Jan | 34.44 | 32.85 | 37.05 | 11.35 |
| Feb | 37.62 | 35.47 | 39.20 | 9.50 |
| Mar | 38.37 | 36.13 | 39.21 | 7.86 |
| Apr | 39.17 | 37.45 | 41.63 | 10.04 |
| May | 36.89 | 36.07 | 39.20 | 7.97 |
| Jun | 33.88 | 30.90 | 35.75 | 13.55 |
| Jul | 31.87 | 29.17 | 33.76 | 13.60 |
| Aug | 32.68 | 30.20 | 34.15 | 11.58 |
| Sep | 34.73 | 33.62 | 37.25 | 9.74 |
| Oct | 36.41 | 33.92 | 37.69 | 9.99 |
| Nov | 37.89 | 37.06 | 41.22 | 10.11 |
| Dec | 38.64 | 35.32 | 41.19 | 14.24 |
DraftKings (DKNG) Monthly Stock Prediction for 2026
| Month | Target | Pes. | Opt. | Vol., % |
|---|---|---|---|---|
| Jan | 41.32 | 39.36 | 44.68 | 11.90 |
| Feb | 45.18 | 43.74 | 46.37 | 5.68 |
| Mar | 42.25 | 41.22 | 43.97 | 6.24 |
| Apr | 39.32 | 38.24 | 41.74 | 8.39 |
| May | 40.88 | 38.67 | 42.77 | 9.57 |
| Jun | 41.55 | 38.35 | 45.21 | 15.17 |
| Jul | 41.32 | 39.60 | 44.23 | 10.48 |
| Aug | 45.64 | 42.98 | 49.61 | 13.36 |
| Sep | 49.61 | 47.37 | 52.01 | 8.92 |
| Oct | 49.55 | 46.66 | 51.08 | 8.64 |
| Nov | 48.41 | 46.86 | 51.60 | 9.18 |
| Dec | 51.02 | 48.38 | 54.33 | 10.95 |
DraftKings (DKNG) Monthly Stock Prediction for 2027
| Month | Target | Pes. | Opt. | Vol., % |
|---|---|---|---|---|
| Jan | 46.86 | 44.44 | 49.29 | 9.83 |
| Feb | 49.18 | 47.24 | 50.86 | 7.13 |
| Mar | 49.67 | 46.28 | 51.86 | 10.75 |
| Apr | 52.29 | 50.86 | 54.25 | 6.26 |
| May | 52.29 | 49.76 | 56.78 | 12.36 |
| Jun | 55.86 | 54.63 | 58.50 | 6.62 |
| Jul | 54.82 | 52.70 | 56.26 | 6.32 |
| Aug | 60.18 | 56.47 | 63.62 | 11.24 |
| Sep | 57.86 | 53.03 | 60.98 | 13.05 |
| Oct | 57.23 | 54.46 | 59.18 | 7.98 |
| Nov | 60.38 | 58.85 | 64.16 | 8.28 |
| Dec | 62.90 | 61.17 | 66.43 | 7.92 |
DraftKings (DKNG) Monthly Stock Prediction for 2028
| Month | Target | Pes. | Opt. | Vol., % |
|---|---|---|---|---|
| Jan | 61.24 | 55.92 | 65.48 | 14.61 |
| Feb | 62.25 | 60.20 | 66.56 | 9.57 |
| Mar | 68.82 | 67.16 | 72.31 | 7.12 |
| Apr | 68.97 | 66.85 | 73.00 | 8.42 |
| May | 70.95 | 65.17 | 75.32 | 13.47 |
| Jun | 70.24 | 67.31 | 73.34 | 8.22 |
| Jul | 75.89 | 73.55 | 80.48 | 8.61 |
| Aug | 72.13 | 66.26 | 75.86 | 12.66 |
| Sep | 73.40 | 70.73 | 77.03 | 8.18 |
| Oct | 78.89 | 73.68 | 80.71 | 8.71 |
| Nov | 78.28 | 71.91 | 83.19 | 13.56 |
| Dec | 78.02 | 73.82 | 84.89 | 13.04 |
DraftKings information and performance
222 BERKELEY STREET, BOSTON, MA, US
Market capitalization of the DraftKings Inc. is the total market value of all issued shares of a company. It is calculated by the formula multiplying the number of DKNG shares in the company outstanding by the market price of one share.
EBITDA of DraftKings is earnings before interest, income tax and depreciation of assets.
P/E ratio (price to earnings) - shows the ratio between the price of a share and the company's profit
Price/earnings to growth
Dividend Per Share is a financial indicator equal to the ratio of the company's net profit available for distribution to the annual average of ordinary shares.
Dividend yield is a ratio that shows how much a company pays in dividends each year at the stock price.
EPS shows how much of the net profit is accounted for by the common share.
Trailing P/E depends on what has already been done. It uses the current share price and divides it by the total earnings per share for the last 12 months.
Forward P/E uses projections of future earnings instead of final numbers.
Enterprise Value (EV) /Revenue
The EV / EBITDA ratio shows the ratio of the cost (EV) to its profit before tax, interest and amortization (EBITDA).
Number of issued ordinary shares
Number of freely tradable shares
Shares Short Prior Month - the number of shares in short positions in the last month.
Related stocks from Financial sector


