


July 14, 2024 This Week Top S&P 500 Gainers & Losers

Tesla Q2: The Bottom Is Likely In


Tesla: Time To Take Profits

Microsoft: The Q4 Results Should Surprise You

Tesla: Optimus And FSD Probably Won’t Save The Day

April 23, 2024 Maximizing Profits: When is the Right Time to Sell Your Business?

April 12, 2024 Improve Your Financial Status: A How-To Guide
April 12, 2024 How ZIM Integrated Container Tracking is Revolutionizing Global Trade

March 15, 2024 6 Best Growth Stocks To Buy Now According to Metatrader 5

Caterpillar (CAT) Stock Forecast for 2024–2028. Sell or Buy?
Updated: July 27, 2024 (04:47)
Sector: IndustrialsThe share price of Caterpillar Inc. (CAT) now
50/200 Day Moving Average: $338.24 / $311.9
This figure corresponds to the Average Price over the previous 50/200 days. For Caterpillar stocks, the 50-day moving average is the support level today.
For Caterpillar stocks, the 200-day moving average is the support level today.
Are you interested in Caterpillar Inc. stocks and want to buy them, or are they already in your portfolio? If yes, then on this page you will find useful information about the dynamics of the Caterpillar stock price in 2024, 2025, 2026, 2027, 2028. How much will one Caterpillar share be worth in 2024 - 2028?
When should I take profit in Caterpillar stock? When should I record a loss on Caterpillar stock? What are analysts' forecasts for Caterpillar stock? What is the future of Caterpillar stock? We forecast Caterpillar stock performance using neural networks based on historical data on Caterpillar stocks. Also, when forecasting, technical analysis tools are used, world geopolitical and news factors are taken into account.
Caterpillar stock prediction results are shown below and presented in the form of graphs, tables and text information, divided into time intervals. (Next month, 2024, 2025, 2026, 2027 and 2028) The final quotes of the instrument at the close of the previous trading day are a signal to adjust the forecasts for Caterpillar shares. This happens once a day.
Historical and forecast chart of Caterpillar stock
The chart below shows the historical price of Caterpillar stock and a prediction chart for the next month. For convenience, prices are divided by color. Forecast prices include: Optimistic Forecast, Pessimistic Forecast, and Weighted Average Best Forecast. Detailed values for the Caterpillar stock price can be found in the table below.
Long-term forecasts by years.


When forecasting the rate of CAT stocks, numerous factors come into play. Among these, Caterpillar's improved profitability and robust cash flow stand out, having doubled since 2012. This financial stability not only supports operations and growth but also ensures consistent dividends and share buybacks, enticing long-term investors.
Another significant factor is Caterpillar's growing service revenue. By focusing on recurring service income rather than just cyclical equipment sales, the company reduces revenue volatility, enhancing predictability. This shift gives investors confidence in CAT's ability to generate consistent returns, thereby driving its stock price higher.
Technological and Economic Influences
Technological integrations and innovations also play a crucial role. The use of advanced technology for condition monitoring and predictive maintenance makes CAT’s products more competitive and cost-effective, attracting a broader customer base. Furthermore, economic diversification across sectors like construction, resources, and energy/transportation helps offset downturns in any single market, supporting revenue stability.
However, global economic conditions pose potential challenges. Weakness in Europe's manufacturing sector, China’s housing market, and the U.S. manufacturing growth can impact demand for Caterpillar's machinery. Analysts need to weigh these factors carefully, considering both economic headwinds and the company’s strengths.
- Improved profitability and cash flow
- Growing service revenue
- Technological innovations
- Economic diversification
Analysts predicting CAT stock price should factor in these elements to adjust for both potential growth and economic risks. With balanced consideration, a comprehensive CAT stock forecast can be formulated, aiding investors in making informed decisions.
Certain keywords like 'CAT stock forecast' and 'Caterpillar stock forecast' are integral to understanding these dynamics. It's essential to also consider terms like 'CAT stock price prediction' and 'is CAT a good stock to buy' when assessing market perceptions and strategizing investment decisions in Caterpillar stocks.
Review the original Analysis

Forecasting CAT Stock Rates: Key Factors Influencing Future Changes

Investors keen on predicting changes in CAT stock rates should closely monitor a few critical elements in the near future. Understanding these factors can help analysts make informed decisions on whether to buy or sell Caterpillar stocks. Here, we delve into the primary events and conditions that are set to play pivotal roles in shaping Caterpillar’s stock performance.
Key Influencers: Construction Activity and Manufacturing PMI
The most significant factor set to influence CAT stock rates is construction activity and US infrastructure investment. As construction spending in the US shows signs of decline, coupled with uncertainties surrounding infrastructure investments, the sales outlook for Caterpillar is poised to suffer. This projected decline in sales is likely to negatively impact the value of CAT stocks.
Furthermore, the Manufacturing Purchasing Managers' Index (PMI) serves as an essential indicator of industrial activity, and a decline in PMI typically forecasts a drop in Caterpillar's annual sales. Analysts monitoring these indicators can gain valuable insights into the potential downward trend in CAT stock prices.
Although many analysts forecast a 3-4% annualized sales growth for Caterpillar, this optimism might be overestimated. Based on current trends in construction activity and the manufacturing PMI, a slowdown or even decline in sales growth could materialize.
On a positive note, Caterpillar's high operating profit margin and lack of direct competition could help cushion some of the adverse impacts on its stock value. The company's virtual monopoly and efficient management might maintain relatively high profit margins, despite potential sales declines.
By closely examining these factors, analysts can develop a more nuanced and accurate prediction regarding CAT stock price changes. Understanding the interplay between construction activity, manufacturing PMI, sales growth outlook, and profit margins will enable investors to make well-informed decisions on whether CAT is a good stock to buy or sell.
- Construction activity and US infrastructure investment
- Manufacturing PMI
- Sales growth outlook
- Profit margin and competition
With these insights, analysts can leverage these critical factors to make the most accurate CAT stock price predictions and set realistic CAT stock price targets. Whether deciding to buy or sell Caterpillar stocks, the information provided should serve as a comprehensive guide.
Review the original Analysis

Decoding Caterpillar's Future: A Deep Dive into CAT Stock Predictions
As investors navigate the complex landscapes of the stock market, the Caterpillar (CAT) company's stock forecast emerges as a critical focal point. Renowned for its heavy machinery, CAT's financial health is deeply intertwined with the construction and mining sectors. Analysts tuning in to forecast CAT's stock movements are closely monitoring several key influencers that could sway the company's stock rate in the near future.
The Critical Factors Influencing CAT Stock
At the top of these considerations are the conditions in the construction and mining industries. A potential downturn in these sectors is expected to significantly dampen CAT's sales, presenting a bearish outlook for the CAT stock forecast. Such cycles of decline often prompt questions like "is CAT a good stock to buy?" Among investors and analysts alike, pinpointing the timing of these industry fluctuations becomes essential for making informed decisions.
Furthermore, the specter of high interest rates looms large. A "higher for longer" interest rate scenario could throttle construction spending, putting additional pressure on CAT's sales, and hence affecting the Caterpillar stock forecast. Analysts consider these trends in their CAT stock price prediction, assessing the wider economic landscape to gauge potential movements.
Lastly, projected capex reductions in the mining industry could serve as another headwind for CAT, impacting its Resource Industries segment. Analysts pondering over "CAT stock buy or sell" weigh these capex forecasts heavily, understanding that lower investment in mining equipment could lead to diminished sales for Caterpillar.
In descending order of impact, analysts prioritize:
- Construction and mining industry conditions
- Interest rates
- Capital expenditure in the mining industry
Given these considerations, analysts strive to offer grounded predictions, steering clear of over-optimism or undue pessimism. Investors seeking to navigate the "buy or sell Caterpillar stock" dilemma will find these insights invaluable for making astute investment choices in the face of an unpredictable future.
Review the original Analysis
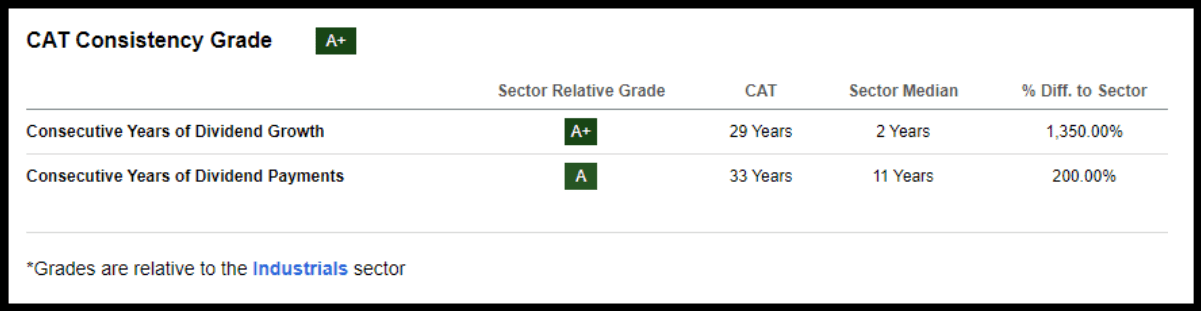
Caterpillar Inc. is revolutionizing the industrial sphere with its cutting-edge construction and machinery operations, logistics integration, and service distribution. Apart from leveraging artificial intelligence in autonomous machinery, Caterpillar also stands out for its exceptional dividend growth, which spans years, as opposed to the industry average of two years—a whopping 1,350% difference.
Caterpillar’s consistency grade reveals some tempting valuation metrics. The company’s forward P/E sits at an appealing 14.66x when compared to the industry’s 19.53x. Its forward PEG also beats the industry average at 1.06x compared to 1.66x.
With heightened demand for construction equipment, CAT benefited from corporate restocks in the first half of 2023. As a global heavy machinery leader, Caterpillar will likely see a boost in sales growth as economies rebound and U.S. infrastructure spending climbs.
In the past 90 days alone, strong earnings exceeding predictions have triggered 24 FY1 upward analyst revisions. The second quarter reported an EPS of $5.55 that outrightly outperformed by $0.97 and revenues shot up nearly 22% year-over-year at $17.32 billion.
Company CEO James Umpleby shed light on CAT’s robust dividend growth grade and free cash flow performance during a recent Q2 earnings call.
He announced a healthy ME&T free cash flow of $2.6 billion collected during Q2 itself, wherein they returned $2 billion to shareholders—$1.4 billion via stock repurchase and $600 million through dividends.
Umpleby proudly stated an anticipated dividend increase of 8%, resulting in a quarterly dividend per share climbing by an impressive 51% since May 2019 when they launched their existing capital allocation strategy.
Caterpillar solidifies its stance as a dependable investment option with its commendable dividend scorecard which includes a 26.82% dividend payout ratio, superior B+ dividend safety grade, and a five-year growth rate of 8.9%. These promising facets make Caterpillar a worthy contestant for your investment portfolio inclusion.
The Reasons Why You Should Consider Buying Caterpillar
Caterpillar stands out as a solid investment choice, particularly because it boasts the status of a dividend aristocrat, with over 25 successive years of increasing dividends—a testament to its financial resilience. Despite its stock taking a hit and tumbling from nearly $300 down to about $226 in the past three months, savvy investors might see this as a buying opportunity, seeing that shares have since rebounded to around $246.
This company is a mainstay in the construction and mining sectors, known for manufacturing heavy-duty equipment that’s crucial for infrastructure development. Whether you pass by a construction site on your way to work or notice renovations at your local shopping center, there’s a good chance Caterpillar machinery is at the heart of these projects. With an ever-present demand for construction and development, Caterpillar’s foothold in supplying necessary equipment seems robust.
Considering this strong market position, it’s logical for an investor to consider Caterpillar as a potentially lucrative long-term bet. The pertinent questions remain about the company’s capacity for growth and its future outlook, but with its indispensable role in ongoing global development, Caterpillar appears well-positioned for enduring success.
Conservative Growth Outlook
Caterpillar has been growing earnings at a modest rate of around 3% a year, and despite a less rosy forecast compared to the last five years, they still favor the slow but stable progress. Overall financial metrics are ticking up slightly, with earnings and revenue expected to inch up by around 1.7% and 3.2%, while operating cash flow and free cash flow are looking at around 4% growth over the next couple of years.
Even though these numbers aren’t eye-popping, given the shaky economic outlook and potential recession on the horizon, this kind of growth is seen as commendable. What’s more, Caterpillar has surpassed expectations with a solid latest earnings report—sales are up 12%, profit margins have improved, and they’ve generated significant free cash flow while continuing to reward shareholders generously through buybacks and dividends.
Solid Financial Standing
One key aspect that labels a stock as top-tier is its robust financial health. By the conclusion of the recent quarter, Caterpillar (CAT) had an impressive $6.5 billion nest egg on hand, backed up by a sturdy interest coverage ratio. Plus, they’d stashed away an extra $4.3 billion in slightly longer-term liquid stocks to pump up returns on their cash reserves.
When matched against other market players, CAT flaunts one of the lowest net debt-to-EBITDA ratios at a minor 0.47x—well below competitors such as Cummins Inc. (CMI), and Deere & Co.(DE), both clocking in 1.10x apiece. Although CAT’s debt has seen a marginal uptick over the past years, the company has managed to keep its cash and debt balance steady.
Compared to its rivals, though, CAT does shoulder a significantly larger debt that might ruffle feathers among investors, especially considering the current high interest rate scenario. However, for a large-cap company with a fortified competitive advantage like Caterpillar, this is hardly cause for sleepless nights.

Caterpillar daily forecast for a month
| Date | Target | Pes. | Opt. | Vol., % |
|---|---|---|---|---|
| Jul 29 | 360.15 | 356.40 | 365.48 | 2.55 |
| Jul 30 | 361.95 | 360.50 | 366.07 | 1.55 |
| Jul 31 | 364.41 | 361.86 | 369.07 | 1.99 |
| Aug 01 | 367.98 | 364.23 | 369.75 | 1.52 |
| Aug 02 | 374.68 | 372.05 | 378.50 | 1.73 |
| Aug 03 | 375.20 | 370.40 | 378.43 | 2.17 |
| Aug 04 | 378.28 | 375.78 | 382.29 | 1.73 |
| Aug 05 | 374.50 | 369.40 | 378.99 | 2.60 |
| Aug 06 | 369.10 | 363.86 | 375.01 | 3.06 |
| Aug 07 | 371.10 | 369.54 | 375.92 | 1.73 |
| Aug 08 | 368.28 | 365.48 | 372.62 | 1.95 |
| Aug 09 | 375.13 | 372.35 | 379.48 | 1.91 |
| Aug 10 | 372.05 | 369.30 | 375.70 | 1.73 |
| Aug 11 | 376.89 | 374.85 | 382.62 | 2.07 |
| Aug 12 | 373.34 | 369.98 | 377.08 | 1.92 |
| Aug 13 | 370.58 | 365.84 | 374.21 | 2.29 |
| Aug 14 | 369.17 | 365.04 | 373.60 | 2.35 |
| Aug 15 | 365.92 | 364.09 | 367.68 | 0.98 |
| Aug 16 | 366.88 | 364.89 | 370.98 | 1.67 |
| Aug 17 | 363.94 | 361.54 | 367.73 | 1.71 |
| Aug 18 | 364.45 | 361.90 | 367.00 | 1.41 |
| Aug 19 | 367.00 | 361.72 | 371.33 | 2.66 |
| Aug 20 | 371.99 | 369.09 | 375.71 | 1.79 |
| Aug 21 | 373.26 | 369.60 | 378.86 | 2.50 |
| Aug 22 | 372.66 | 369.16 | 378.18 | 2.44 |
| Aug 23 | 379.96 | 375.18 | 381.94 | 1.80 |
| Aug 24 | 377.53 | 374.74 | 379.34 | 1.23 |
| Aug 25 | 380.17 | 377.36 | 382.91 | 1.47 |
| Aug 26 | 374.62 | 372.38 | 380.24 | 2.11 |
| Aug 27 | 375.82 | 370.94 | 379.21 | 2.23 |
Caterpillar Daily Price Targets
Caterpillar Stock Forecast 07-29-2024.
Forecast target price for 07-29-2024: $360.15.
Positive dynamics for Caterpillar shares will prevail with possible volatility of 2.483%.
Pessimistic target level: 356.40
Optimistic target level: 365.48
Caterpillar Stock Forecast 07-30-2024.
Forecast target price for 07-30-2024: $361.95.
Positive dynamics for Caterpillar shares will prevail with possible volatility of 1.523%.
Pessimistic target level: 360.50
Optimistic target level: 366.07
Caterpillar Stock Forecast 07-31-2024.
Forecast target price for 07-31-2024: $364.41.
Positive dynamics for Caterpillar shares will prevail with possible volatility of 1.955%.
Pessimistic target level: 361.86
Optimistic target level: 369.07
Caterpillar Stock Forecast 08-01-2024.
Forecast target price for 08-01-2024: $367.98.
Positive dynamics for Caterpillar shares will prevail with possible volatility of 1.493%.
Pessimistic target level: 364.23
Optimistic target level: 369.75
Caterpillar Stock Forecast 08-02-2024.
Forecast target price for 08-02-2024: $374.68.
Positive dynamics for Caterpillar shares will prevail with possible volatility of 1.703%.
Pessimistic target level: 372.05
Optimistic target level: 378.50
Caterpillar Stock Forecast 08-03-2024.
Forecast target price for 08-03-2024: $375.20.
Positive dynamics for Caterpillar shares will prevail with possible volatility of 2.122%.
Pessimistic target level: 370.40
Optimistic target level: 378.43
CAT (CAT) Monthly Stock Prediction for 2024
| Month | Target | Pes. | Opt. | Vol., % |
|---|---|---|---|---|
| Aug. | 361.58 | 343.14 | 377.85 | 9.19 |
| Sep. | 364.83 | 342.94 | 380.89 | 9.96 |
| Oct. | 346.96 | 337.24 | 360.14 | 6.36 |
| Nov. | 346.26 | 327.56 | 353.53 | 7.35 |
| Dec. | 357.69 | 346.96 | 385.95 | 10.10 |
Caterpillar forecast for this year
Caterpillar Stock Prediction for Aug 2024
An uptrend is forecast for this month with an optimal target price of $361.579. Pessimistic: $343.14. Optimistic: $377.85
Caterpillar Stock Prediction for Sep 2024
An uptrend is forecast for this month with an optimal target price of $364.833. Pessimistic: $342.94. Optimistic: $380.89
Caterpillar Stock Prediction for Oct 2024
An downtrend is forecast for this month with an optimal target price of $346.956. Pessimistic: $337.24. Optimistic: $360.14
Caterpillar Stock Prediction for Nov 2024
An downtrend is forecast for this month with an optimal target price of $346.263. Pessimistic: $327.56. Optimistic: $353.53
Caterpillar Stock Prediction for Dec 2024
An uptrend is forecast for this month with an optimal target price of $357.689. Pessimistic: $346.96. Optimistic: $385.95
Caterpillar (CAT) Monthly Stock Prediction for 2025
| Month | Target | Pes. | Opt. | Vol., % |
|---|---|---|---|---|
| Jan | 348.03 | 334.46 | 368.57 | 9.25 |
| Feb | 349.08 | 338.60 | 358.50 | 5.55 |
| Mar | 354.66 | 328.06 | 365.66 | 10.28 |
| Apr | 366.01 | 342.59 | 374.79 | 8.59 |
| May | 377.36 | 359.24 | 396.98 | 9.51 |
| Jun | 367.55 | 357.25 | 379.67 | 5.91 |
| Jul | 368.28 | 350.97 | 384.48 | 8.72 |
| Aug | 370.12 | 360.13 | 397.88 | 9.49 |
| Sep | 380.86 | 350.39 | 397.61 | 11.88 |
| Oct | 377.05 | 355.18 | 386.85 | 8.19 |
| Nov | 358.95 | 332.39 | 386.59 | 14.02 |
| Dec | 360.74 | 346.31 | 379.86 | 8.83 |
Caterpillar (CAT) Monthly Stock Prediction for 2026
| Month | Target | Pes. | Opt. | Vol., % |
|---|---|---|---|---|
| Jan | 391.77 | 380.41 | 410.96 | 7.44 |
| Feb | 381.97 | 363.26 | 394.96 | 8.03 |
| Mar | 378.54 | 348.63 | 388.38 | 10.23 |
| Apr | 371.72 | 355.74 | 389.19 | 8.60 |
| May | 372.09 | 357.58 | 393.67 | 9.17 |
| Jun | 369.12 | 342.54 | 395.32 | 13.35 |
| Jul | 384.99 | 373.82 | 392.69 | 4.80 |
| Aug | 366.89 | 354.42 | 383.77 | 7.65 |
| Sep | 348.55 | 334.96 | 364.58 | 8.13 |
| Oct | 340.18 | 312.97 | 362.30 | 13.62 |
| Nov | 341.89 | 315.90 | 354.54 | 10.90 |
| Dec | 310.43 | 298.64 | 328.44 | 9.07 |
Caterpillar (CAT) Monthly Stock Prediction for 2027
| Month | Target | Pes. | Opt. | Vol., % |
|---|---|---|---|---|
| Jan | 281.25 | 262.41 | 297.85 | 11.90 |
| Feb | 292.50 | 269.98 | 308.30 | 12.43 |
| Mar | 286.36 | 280.63 | 293.52 | 4.39 |
| Apr | 305.83 | 288.70 | 326.32 | 11.53 |
| May | 302.47 | 281.90 | 320.01 | 11.91 |
| Jun | 324.55 | 302.80 | 332.66 | 8.98 |
| Jul | 340.77 | 316.24 | 365.65 | 13.51 |
| Aug | 354.41 | 339.52 | 369.65 | 8.15 |
| Sep | 380.63 | 373.02 | 397.38 | 6.13 |
| Oct | 391.67 | 381.09 | 423.00 | 9.91 |
| Nov | 361.12 | 340.17 | 385.31 | 11.72 |
| Dec | 360.40 | 332.65 | 375.17 | 11.34 |
Caterpillar (CAT) Monthly Stock Prediction for 2028
| Month | Target | Pes. | Opt. | Vol., % |
|---|---|---|---|---|
| Jan | 348.14 | 325.51 | 363.81 | 10.53 |
| Feb | 335.26 | 313.47 | 351.36 | 10.78 |
| Mar | 333.25 | 324.92 | 355.58 | 8.62 |
| Apr | 340.25 | 325.28 | 363.05 | 10.40 |
| May | 333.78 | 313.42 | 349.81 | 10.40 |
| Jun | 359.82 | 333.55 | 381.77 | 12.63 |
| Jul | 342.19 | 331.58 | 363.40 | 8.76 |
| Aug | 343.56 | 328.78 | 365.20 | 9.97 |
| Sep | 347.34 | 335.53 | 367.13 | 8.61 |
| Oct | 376.51 | 356.93 | 386.68 | 7.69 |
| Nov | 388.18 | 371.10 | 413.42 | 10.23 |
| Dec | 380.81 | 350.34 | 391.09 | 10.42 |
Caterpillar information and performance
510 LAKE COOK ROAD, SUITE 100, DEERFIELD, IL, US
Market capitalization of the Caterpillar Inc. is the total market value of all issued shares of a company. It is calculated by the formula multiplying the number of CAT shares in the company outstanding by the market price of one share.
EBITDA of Caterpillar is earnings before interest, income tax and depreciation of assets.
P/E ratio (price to earnings) - shows the ratio between the price of a share and the company's profit
Price/earnings to growth
Dividend Per Share is a financial indicator equal to the ratio of the company's net profit available for distribution to the annual average of ordinary shares.
Dividend yield is a ratio that shows how much a company pays in dividends each year at the stock price.
EPS shows how much of the net profit is accounted for by the common share.
Trailing P/E depends on what has already been done. It uses the current share price and divides it by the total earnings per share for the last 12 months.
Forward P/E uses projections of future earnings instead of final numbers.
Enterprise Value (EV) /Revenue
The EV / EBITDA ratio shows the ratio of the cost (EV) to its profit before tax, interest and amortization (EBITDA).
Number of issued ordinary shares
Number of freely tradable shares
Shares Short Prior Month - the number of shares in short positions in the last month.
Caterpillar (CAT) stock dividend
Caterpillar last paid dividends on 07/22/2024. The next scheduled payment will be on 08/20/2024. The amount of dividends is $5.2 per share. If the date of the next dividend payment has not been updated, it means that the issuer has not yet announced the exact payment. As soon as information becomes available, we will immediately update the data. Bookmark our portal to stay updated.
Last Split Date: 01/01/1970
Splitting of shares is an increase in the number of securities of the issuing company circulating on the market due to a decrease in their value at constant capitalization.
For example, a 5: 1 ratio means that the value of one share will decrease 5 times, the total amount will increase 5 times. It is important to understand that this procedure does not change the capitalization of the company, as well as the total value of assets held in private hands.


