


July 14, 2024 This Week Top S&P 500 Gainers & Losers


Tesla: Time To Take Profits

Microsoft: The Q4 Results Should Surprise You

Tesla: Optimus And FSD Probably Won’t Save The Day


April 23, 2024 Maximizing Profits: When is the Right Time to Sell Your Business?

April 12, 2024 Improve Your Financial Status: A How-To Guide
April 12, 2024 How ZIM Integrated Container Tracking is Revolutionizing Global Trade

March 15, 2024 6 Best Growth Stocks To Buy Now According to Metatrader 5

Applied Materials (AMAT) Stock Forecast for 2024–2028. Sell or Buy?
Updated: July 26, 2024 (21:06)
Sector: TechnologyThe share price of Applied Materials, Inc. (AMAT) now
50/200 Day Moving Average: $228.28 / $187.04
This figure corresponds to the Average Price over the previous 50/200 days. For Applied Materials stocks, the 50-day moving average is the resistance level today.
For Applied Materials stocks, the 200-day moving average is the support level today.
Are you interested in Applied Materials, Inc. stocks and want to buy them, or are they already in your portfolio? If yes, then on this page you will find useful information about the dynamics of the Applied Materials stock price in 2024, 2025, 2026, 2027, 2028. How much will one Applied Materials share be worth in 2024 - 2028?
When should I take profit in Applied Materials stock? When should I record a loss on Applied Materials stock? What are analysts' forecasts for Applied Materials stock? What is the future of Applied Materials stock? We forecast Applied Materials stock performance using neural networks based on historical data on Applied Materials stocks. Also, when forecasting, technical analysis tools are used, world geopolitical and news factors are taken into account.
Applied Materials stock prediction results are shown below and presented in the form of graphs, tables and text information, divided into time intervals. (Next month, 2024, 2025, 2026, 2027 and 2028) The final quotes of the instrument at the close of the previous trading day are a signal to adjust the forecasts for Applied Materials shares. This happens once a day.
Historical and forecast chart of Applied Materials stock
The chart below shows the historical price of Applied Materials stock and a prediction chart for the next month. For convenience, prices are divided by color. Forecast prices include: Optimistic Forecast, Pessimistic Forecast, and Weighted Average Best Forecast. Detailed values for the Applied Materials stock price can be found in the table below.
Long-term forecasts by years.
Key Factors Impacting Applied Materials (AMAT) Stock Forecast

Applied Materials (AMAT) stock is under intense scrutiny, with several key factors influencing its future performance. Analysts and investors must consider a variety of events and market dynamics to forecast AMAT's stock rates accurately.
Major Influences on AMAT Stock Rates
Several events and factors will most significantly impact AMAT stock rates in the near future. Foremost are the U.S. export controls on advanced semiconductor manufacturing equipment to China, leading to reduced revenue opportunities and significant market capitalization losses. This challenge is compounded by fierce competition from Naura Technology Group, which has demonstrated robust financial growth, capturing significant market share that threatens AMAT’s position.
- Export Controls: The restrictions have already led to a $130 billion market cap reduction for American semiconductor firms, including AMAT. Any further tightening of these controls could exacerbate revenue loss.
- Competition from Naura Technology Group: Naura's revenue growth of 51.36% highlights its dominance and potential to undermine AMAT's market share.
- Supply Chain Constraints: Persistent supply bottlenecks disrupt operations, leading to delays, increased costs, and inventory issues, all impacting profitability.
- Share Buyback Programs: While buybacks have provided a temporary boost to EPS, they might not suffice if operational performance doesn’t improve.
- Revenue from China: Despite revenue growth in China, the looming possibility of tighter restrictions poses a significant risk.
To leverage these factors for accurate AMAT stock price predictions, analysts should closely monitor regulatory changes, competitive dynamics, and supply chain developments. They should balance short-term financial engineering benefits against long-term operational performance. Applying these insights, analysts can provide a nuanced AMAT stock forecast, guiding whether AMAT remains a good stock to buy.
Thus, comprehending the intersecting impact of export controls, competitive pressures, supply chain issues, and financial maneuvers is essential for predicting AMAT's stock price trajectory. Keeping an eye on these dynamics will determine if AMAT stock remains a viable investment opportunity amid ongoing uncertainties.
Review the original Analysis

AMAT Stock Surge: Mastering the Semiconductor Growth Wave

In the rapidly evolving semiconductor sector, pinpointing the volte-face in AMAT stock prices encapsulates a complex, yet fascinating challenge. Analysts looking to master the forecast of AMAT stock rates are scrutinizing a blend of pivotal factors, poised to sculpt the future trajectory of Applied Materials' market performance. At the core, the growth outlook, buoyed by significant expansions from heavyweights like TSMC, Samsung, and Intel, especially in regions ripe for tech advancements such as the US and Europe, emerges as the quintessential catalyst. This growth is not just a number but a reflection of AMAT's entrenched role in powering the next tech epoch, thereby making AMAT stock forecast a topic of high relevance.
Zooming in: Drivers Shaping AMAT's Market Destiny
Yet, the plot thickens with market sentiments, swaying in response to the semiconductor industry's pulsating growth outlook, intertwined closely with groundbreaking technologies such as AI, Cloud, IoT, ADAS, and 5G. These trends, far from being mere buzzwords, are intricately connected to AMAT stock price prediction, laying a fertile ground for revenue and profit upticks. However, the vibrant tapestry of the market share dynamics, particularly with ASML’s expected rebound, adds another layer of complexity, carefully stitched into the fabric of AMAT stock price target considerations.
Analysts poised to unravel the AMAT stock price forecast puzzle are leveraging this multifaceted landscape. They marry the expansive growth outlook with shifting market sentiments and nuanced market share interplays to craft nuanced AMAT stock buy or sell recommendations. As the question of whether is AMAT a good stock to buy floats in the air, the answer seems to weave through the intricate dance of technological advancements and strategic corporate expansions.
Conclusively, the blend of these factors charts a compelling narrative for Applied Materials, promising to keep AMAT stock buy or sell debates lively. Analysts and investors alike are poised on the edge, as the orchestrated symphony of market drivers plays out, determining whether the Applied Materials stock forecast will soar to new heights or navigate through turbulent clouds.
Review the original Analysis

AMAT Stock Forecast: Navigating Through AI Hype and Valuation Waves
In the ever-volatile world of stock markets, discerning the course of Applied Materials (AMAT) stock prices feels akin to predicting the weather. Nevertheless, several pivotal events and factors stand out in their potential to shape AMAT's financial climate in the near future. Among these, earnings growth, valuation, AI-driven sentiment, and balance sheet solidity take the spotlight. Analysts armed with insights into these dynamics can aim for more accurate AMAT stock forecasts, trying to peer through the fog of stock market unpredictability.
Key Indicators to Watch in AMAT Stock Predictions
Tepid earnings growth juxtaposed with the company's soaring stock price introduces a cautionary tale of hype possibly outpacing reality. The AMAT stock forecast becomes a tale of two narratives: the AI-driven enthusiasm propelling the stock price upward, against the slower actual growth in earnings. Analysts focusing on this discrepancy could anticipate potential adjustments in the stock price, as investor exuberance cools off and prices seek alignment with fundamental values.
The valuation of AMAT also emerges as a critical factor, currently hovering at heights well above historical averages. Such overvaluation flags warnings for sharp-eyed investors, suggesting that any shift in market sentiment—particularly concerning AI—could trigger a significant price correction. Nevertheless, AMAT's robust balance sheet, brimming with net cash close to $1.6 billion, along with prospects for higher dividends, casts a ray of stability and potential appeal amidst the valuation concerns.
For those pondering over whether AMAT is a good stock to buy or sell, these indicators offer valuable breadcrumbs. Is AMAT stock a buy, sell, or hold? The answer seems to dance between its present elevated valuation and the solid bedrock of its financial health, striking at the heart of investment decision-making. Analysts levering these insights stand a better chance at crafting a more nuanced AMAT stock price prediction that weathers both the storms and sunshine forecasted in its market journey.
In synthesizing the AMAT stock forecast, what emerges is a complex landscape where predictions are as much about understanding the company’s positioning within the booming AI sector as they are about grounding these expectations in the bedrock of financial analysis. As excitement around AI propels Applied Materials into the spotlight, keeping a keen eye on these factors becomes indispensable for making informed predictions on whether to buy or sell Applied Materials stock.
Review the original Analysis
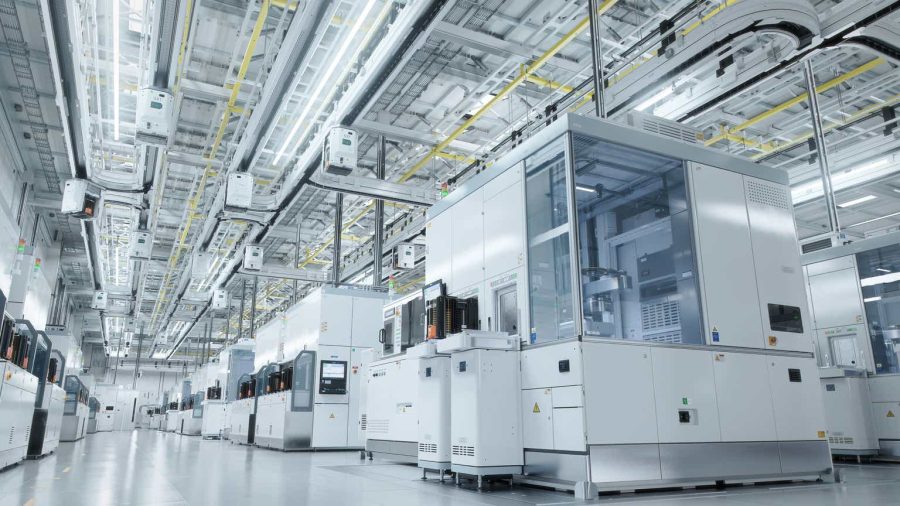
Applied Materials supplies equipment, services and solutions for the electronics manufacturing. The head office is in Santa Clara, California.

Applied Materials daily forecast for a month
| Date | Target | Pes. | Opt. | Vol., % |
|---|---|---|---|---|
| Jul 28 | 205.41 | 202.49 | 208.41 | 2.92 |
| Jul 29 | 206.60 | 204.99 | 209.04 | 1.98 |
| Jul 30 | 205.15 | 204.00 | 206.34 | 1.15 |
| Jul 31 | 206.47 | 203.58 | 208.45 | 2.39 |
| Aug 01 | 205.23 | 203.22 | 206.54 | 1.64 |
| Aug 02 | 206.29 | 204.85 | 207.57 | 1.33 |
| Aug 03 | 206.34 | 205.06 | 207.78 | 1.33 |
| Aug 04 | 205.18 | 203.29 | 206.33 | 1.49 |
| Aug 05 | 204.97 | 202.92 | 206.45 | 1.74 |
| Aug 06 | 205.67 | 203.04 | 208.26 | 2.57 |
| Aug 07 | 205.26 | 201.98 | 208.42 | 3.19 |
| Aug 08 | 206.78 | 205.75 | 208.14 | 1.17 |
| Aug 09 | 207.73 | 204.41 | 210.72 | 3.09 |
| Aug 10 | 210.10 | 208.25 | 211.23 | 1.43 |
| Aug 11 | 209.26 | 207.25 | 211.81 | 2.20 |
| Aug 12 | 208.59 | 206.92 | 209.92 | 1.45 |
| Aug 13 | 207.55 | 205.64 | 210.41 | 2.32 |
| Aug 14 | 211.28 | 207.94 | 213.27 | 2.56 |
| Aug 15 | 208.20 | 206.36 | 211.24 | 2.36 |
| Aug 16 | 206.74 | 205.13 | 208.52 | 1.65 |
| Aug 17 | 206.28 | 205.42 | 207.52 | 1.02 |
| Aug 18 | 205.95 | 203.77 | 207.89 | 2.02 |
| Aug 19 | 206.28 | 205.42 | 207.98 | 1.25 |
| Aug 20 | 210.00 | 206.72 | 212.18 | 2.64 |
| Aug 21 | 211.47 | 209.10 | 213.62 | 2.16 |
| Aug 22 | 212.06 | 208.92 | 213.42 | 2.15 |
| Aug 23 | 212.36 | 210.95 | 213.84 | 1.37 |
| Aug 24 | 209.26 | 208.17 | 212.19 | 1.93 |
| Aug 25 | 210.01 | 208.58 | 212.02 | 1.65 |
| Aug 26 | 208.12 | 205.79 | 210.99 | 2.53 |
Applied Materials Daily Price Targets
Applied Materials Stock Forecast 07-28-2024.
Forecast target price for 07-28-2024: $205.41.
Positive dynamics for Applied Materials shares will prevail with possible volatility of 2.839%.
Pessimistic target level: 202.49
Optimistic target level: 208.41
Applied Materials Stock Forecast 07-29-2024.
Forecast target price for 07-29-2024: $206.60.
Positive dynamics for Applied Materials shares will prevail with possible volatility of 1.937%.
Pessimistic target level: 204.99
Optimistic target level: 209.04
Applied Materials Stock Forecast 07-30-2024.
Forecast target price for 07-30-2024: $205.15.
Negative dynamics for Applied Materials shares will prevail with possible volatility of 1.134%.
Pessimistic target level: 204.00
Optimistic target level: 206.34
Applied Materials Stock Forecast 07-31-2024.
Forecast target price for 07-31-2024: $206.47.
Positive dynamics for Applied Materials shares will prevail with possible volatility of 2.337%.
Pessimistic target level: 203.58
Optimistic target level: 208.45
Applied Materials Stock Forecast 08-01-2024.
Forecast target price for 08-01-2024: $205.23.
Negative dynamics for Applied Materials shares will prevail with possible volatility of 1.610%.
Pessimistic target level: 203.22
Optimistic target level: 206.54
Applied Materials Stock Forecast 08-02-2024.
Forecast target price for 08-02-2024: $206.29.
Positive dynamics for Applied Materials shares will prevail with possible volatility of 1.312%.
Pessimistic target level: 204.85
Optimistic target level: 207.57
AMAT (AMAT) Monthly Stock Prediction for 2024
| Month | Target | Pes. | Opt. | Vol., % |
|---|---|---|---|---|
| Aug. | 213.16 | 204.47 | 222.71 | 8.19 |
| Sep. | 228.51 | 213.89 | 238.38 | 10.28 |
| Oct. | 232.17 | 224.93 | 238.86 | 5.83 |
| Nov. | 226.41 | 216.99 | 238.00 | 8.83 |
| Dec. | 221.16 | 213.55 | 227.53 | 6.14 |
Applied Materials forecast for this year
Applied Materials Stock Prediction for Aug 2024
An uptrend is forecast for this month with an optimal target price of $213.164. Pessimistic: $204.47. Optimistic: $222.71
Applied Materials Stock Prediction for Sep 2024
An uptrend is forecast for this month with an optimal target price of $228.512. Pessimistic: $213.89. Optimistic: $238.38
Applied Materials Stock Prediction for Oct 2024
An uptrend is forecast for this month with an optimal target price of $232.168. Pessimistic: $224.93. Optimistic: $238.86
Applied Materials Stock Prediction for Nov 2024
An downtrend is forecast for this month with an optimal target price of $226.411. Pessimistic: $216.99. Optimistic: $238.00
Applied Materials Stock Prediction for Dec 2024
An downtrend is forecast for this month with an optimal target price of $221.158. Pessimistic: $213.55. Optimistic: $227.53
Applied Materials (AMAT) Monthly Stock Prediction for 2025
| Month | Target | Pes. | Opt. | Vol., % |
|---|---|---|---|---|
| Jan | 220.27 | 213.05 | 227.85 | 6.50 |
| Feb | 228.73 | 214.83 | 239.71 | 10.38 |
| Mar | 222.88 | 211.47 | 227.16 | 6.91 |
| Apr | 226.09 | 213.24 | 234.41 | 9.03 |
| May | 222.83 | 214.99 | 233.70 | 8.01 |
| Jun | 219.98 | 216.46 | 228.07 | 5.09 |
| Jul | 216.46 | 203.47 | 220.27 | 7.63 |
| Aug | 225.12 | 216.11 | 231.78 | 6.76 |
| Sep | 237.90 | 230.67 | 249.89 | 7.69 |
| Oct | 234.67 | 229.04 | 248.00 | 7.65 |
| Nov | 241.61 | 237.36 | 253.79 | 6.47 |
| Dec | 252.83 | 238.87 | 256.87 | 7.01 |
Applied Materials (AMAT) Monthly Stock Prediction for 2026
| Month | Target | Pes. | Opt. | Vol., % |
|---|---|---|---|---|
| Jan | 263.34 | 254.49 | 279.35 | 8.90 |
| Feb | 279.14 | 265.07 | 284.50 | 6.83 |
| Mar | 280.48 | 262.53 | 295.07 | 11.03 |
| Apr | 264.55 | 253.97 | 269.84 | 5.88 |
| May | 265.40 | 252.66 | 281.96 | 10.39 |
| Jun | 273.25 | 267.57 | 290.30 | 7.83 |
| Jul | 294.46 | 281.97 | 302.70 | 6.85 |
| Aug | 308.36 | 291.58 | 322.91 | 9.70 |
| Sep | 313.78 | 301.99 | 329.60 | 8.38 |
| Oct | 314.79 | 306.48 | 331.41 | 7.52 |
| Nov | 296.40 | 283.13 | 301.62 | 6.13 |
| Dec | 299.01 | 286.33 | 315.28 | 9.18 |
Applied Materials (AMAT) Monthly Stock Prediction for 2027
| Month | Target | Pes. | Opt. | Vol., % |
|---|---|---|---|---|
| Jan | 307.86 | 291.61 | 313.77 | 7.06 |
| Feb | 319.69 | 313.04 | 338.61 | 7.55 |
| Mar | 323.78 | 311.34 | 335.17 | 7.11 |
| Apr | 348.13 | 334.48 | 357.04 | 6.32 |
| May | 373.75 | 351.32 | 385.71 | 8.91 |
| Jun | 381.52 | 360.16 | 404.41 | 10.94 |
| Jul | 385.79 | 373.45 | 410.18 | 8.95 |
| Aug | 372.83 | 363.29 | 387.75 | 6.31 |
| Sep | 362.09 | 350.22 | 384.40 | 8.89 |
| Oct | 351.09 | 333.39 | 369.06 | 9.67 |
| Nov | 355.02 | 340.53 | 376.60 | 9.58 |
| Dec | 360.42 | 340.52 | 375.70 | 9.36 |
Applied Materials (AMAT) Monthly Stock Prediction for 2028
| Month | Target | Pes. | Opt. | Vol., % |
|---|---|---|---|---|
| Jan | 348.02 | 329.64 | 355.26 | 7.21 |
| Feb | 334.93 | 324.21 | 348.06 | 6.85 |
| Mar | 327.16 | 321.14 | 342.34 | 6.19 |
| Apr | 350.45 | 344.29 | 360.27 | 4.44 |
| May | 374.57 | 351.79 | 392.25 | 10.31 |
| Jun | 393.74 | 380.51 | 417.68 | 8.90 |
| Jul | 415.16 | 396.90 | 439.08 | 9.61 |
| Aug | 443.39 | 422.11 | 463.26 | 8.88 |
| Sep | 440.56 | 427.52 | 468.75 | 8.80 |
| Oct | 454.30 | 433.95 | 480.83 | 9.75 |
| Nov | 467.39 | 452.80 | 495.80 | 8.67 |
| Dec | 453.18 | 444.84 | 470.58 | 5.47 |
Applied Materials information and performance
3050 BOWERS AVE, SANTA CLARA, CA, US
Market capitalization of the Applied Materials, Inc. is the total market value of all issued shares of a company. It is calculated by the formula multiplying the number of AMAT shares in the company outstanding by the market price of one share.
EBITDA of Applied Materials is earnings before interest, income tax and depreciation of assets.
P/E ratio (price to earnings) - shows the ratio between the price of a share and the company's profit
Price/earnings to growth
Dividend Per Share is a financial indicator equal to the ratio of the company's net profit available for distribution to the annual average of ordinary shares.
Dividend yield is a ratio that shows how much a company pays in dividends each year at the stock price.
EPS shows how much of the net profit is accounted for by the common share.
Trailing P/E depends on what has already been done. It uses the current share price and divides it by the total earnings per share for the last 12 months.
Forward P/E uses projections of future earnings instead of final numbers.
Enterprise Value (EV) /Revenue
The EV / EBITDA ratio shows the ratio of the cost (EV) to its profit before tax, interest and amortization (EBITDA).
Number of issued ordinary shares
Number of freely tradable shares
Shares Short Prior Month - the number of shares in short positions in the last month.
Applied Materials (AMAT) stock dividend
Applied Materials last paid dividends on 08/22/2024. The next scheduled payment will be on 09/12/2024. The amount of dividends is $1.36 per share. If the date of the next dividend payment has not been updated, it means that the issuer has not yet announced the exact payment. As soon as information becomes available, we will immediately update the data. Bookmark our portal to stay updated.
Last Split Date: 01/01/1970
Splitting of shares is an increase in the number of securities of the issuing company circulating on the market due to a decrease in their value at constant capitalization.
For example, a 5: 1 ratio means that the value of one share will decrease 5 times, the total amount will increase 5 times. It is important to understand that this procedure does not change the capitalization of the company, as well as the total value of assets held in private hands.


