


July 14, 2024 This Week Top S&P 500 Gainers & Losers

Tesla Q2: The Bottom Is Likely In


Tesla: Time To Take Profits

Microsoft: The Q4 Results Should Surprise You

Tesla: Optimus And FSD Probably Won’t Save The Day

April 23, 2024 Maximizing Profits: When is the Right Time to Sell Your Business?

April 12, 2024 Improve Your Financial Status: A How-To Guide
April 12, 2024 How ZIM Integrated Container Tracking is Revolutionizing Global Trade

March 15, 2024 6 Best Growth Stocks To Buy Now According to Metatrader 5

Albemarle (ALB) Stock Forecast for 2024–2028. Sell or Buy?
Updated: July 27, 2024 (05:21)
Sector: Basic materialsThe share price of Albemarle Corp. (ALB) now
50/200 Day Moving Average: $108.5 / $123.22
This figure corresponds to the Average Price over the previous 50/200 days. For Albemarle stocks, the 50-day moving average is the resistance level today.
For Albemarle stocks, the 200-day moving average is the resistance level today.
Are you interested in Albemarle Corp. stocks and want to buy them, or are they already in your portfolio? If yes, then on this page you will find useful information about the dynamics of the Albemarle stock price in 2024, 2025, 2026, 2027, 2028. How much will one Albemarle share be worth in 2024 - 2028?
When should I take profit in Albemarle stock? When should I record a loss on Albemarle stock? What are analysts' forecasts for Albemarle stock? What is the future of Albemarle stock? We forecast Albemarle stock performance using neural networks based on historical data on Albemarle stocks. Also, when forecasting, technical analysis tools are used, world geopolitical and news factors are taken into account.
Albemarle stock prediction results are shown below and presented in the form of graphs, tables and text information, divided into time intervals. (Next month, 2024, 2025, 2026, 2027 and 2028) The final quotes of the instrument at the close of the previous trading day are a signal to adjust the forecasts for Albemarle shares. This happens once a day.
Historical and forecast chart of Albemarle stock
The chart below shows the historical price of Albemarle stock and a prediction chart for the next month. For convenience, prices are divided by color. Forecast prices include: Optimistic Forecast, Pessimistic Forecast, and Weighted Average Best Forecast. Detailed values for the Albemarle stock price can be found in the table below.
Long-term forecasts by years.
The International Energy Agency’s Stated Policies Scenario (STEPS) projects that by the year 2030, sales of electric vehicles will skyrocket to 36.9 million units annually – that’s a whopping 261.7% leap from figures in 2022!
Albemarle (ALB) Investment Summary:
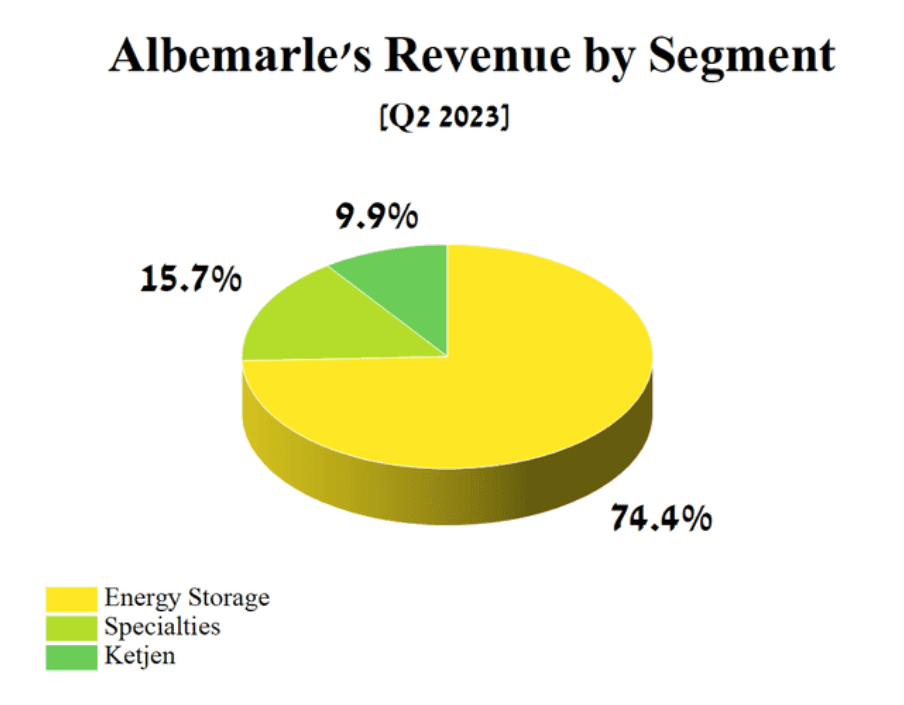
The company in focus runs three primary business arms: Energy Storage, Specialties, and Ketjen. Each offering a wide selection of essential services and products tailored to cater to the automotive, energy, construction, chemical, and petroleum refining sectors.
Crucial to the firm’s functionality is the Energy Storage unit which racked up about 74.4% of its total revenue for Q2 2023. This sector zeroes in on developing, commercializing, and manufacturing lithium-based merchandise.
An Expanded take from Quarterly Financial Reports:
Lithium, an incredible alkali metal that it is, boasts distinctive chemical properties rendering it coveted in creating crucial things like medicinal drugs for mental disorders. Moreover, Lithium also plays a crucial role in the making of everyday essentials such as glass and plastic items as well as lithium-ion batteries – a popular choice among electric vehicles and consumer electronics users.
There’s been speculation due to Albemarle’s share price reduction over recent months. This occurred amid growing fears from financial market participants about possible oversupply of lithium affecting its high-growth rate. We are confident though that the escalating demand within the global lithium-ion battery market could prove critical.
According to data published in 2022, there had been an exponential ascension for electric vehicle sales reaching an all-time high at 10.2 million units sold – marking a year-on-year jump by 56.9%. If we take it back to 2012 when EV sales were just at 118 thousand units worldwide, how far they’ve come is rather impressive.
China contributes significantly to this robust expansion in electric vehicle consumption being spurred by both rapid charging infrastructure advancements and favourable policies by the government.
The International Energy Agency Stated Policies Scenario (STEPS) predicts that by 2030 we could see annual EV sales soaring to approximately 36.9 million units – this translates into a staggering growth of 261.7% from 2022’s recorded sales. With lithium poised to remain pivotal in battery production for the foreseeable future, Albemarle’s products are set to witness strong demand.

Albemarle Corporation (NYSE:ALB), located at Charlotte, North Carolina, is a trailblazer in the international specialty chemicals market.
Albemarle Corporation develops, manufactures and markets specialty chemicals around the world. It is a global company headquartered in Charlotte, North Carolina. It has almost 6 thousand employees and serves clients in about 100 countries. The corporation is one of the world leaders in the field of technologies for the production of fire-resistant chemicals.
The company was founded in February 1994. Starting with blotting paper, the company abandoned paper production in 1976, selling the business, and has been producing bromine in countries such as Jordan and France since the late 1990s.
Albemarle daily forecast for a month
| Date | Target | Pes. | Opt. | Vol., % |
|---|---|---|---|---|
| Jul 29 | 92.32 | 91.46 | 94.40 | 3.21 |
| Jul 30 | 92.49 | 90.80 | 94.63 | 4.22 |
| Jul 31 | 93.68 | 92.45 | 94.64 | 2.37 |
| Aug 01 | 92.73 | 90.70 | 93.98 | 3.62 |
| Aug 02 | 94.59 | 93.48 | 96.24 | 2.94 |
| Aug 03 | 94.93 | 92.79 | 97.07 | 4.60 |
| Aug 04 | 94.90 | 93.42 | 95.96 | 2.71 |
| Aug 05 | 95.24 | 93.47 | 97.22 | 4.00 |
| Aug 06 | 98.02 | 96.75 | 99.75 | 3.10 |
| Aug 07 | 96.69 | 96.02 | 98.66 | 2.75 |
| Aug 08 | 94.63 | 93.21 | 96.65 | 3.69 |
| Aug 09 | 96.62 | 95.29 | 98.24 | 3.10 |
| Aug 10 | 99.23 | 97.50 | 100.75 | 3.33 |
| Aug 11 | 101.19 | 100.53 | 102.53 | 1.99 |
| Aug 12 | 103.11 | 100.82 | 105.52 | 4.66 |
| Aug 13 | 103.91 | 103.22 | 105.75 | 2.45 |
| Aug 14 | 102.51 | 101.83 | 103.74 | 1.87 |
| Aug 15 | 103.43 | 101.35 | 104.76 | 3.37 |
| Aug 16 | 103.93 | 102.09 | 106.26 | 4.09 |
| Aug 17 | 101.65 | 100.83 | 102.60 | 1.75 |
| Aug 18 | 100.25 | 98.44 | 101.66 | 3.27 |
| Aug 19 | 100.52 | 98.47 | 102.66 | 4.26 |
| Aug 20 | 103.35 | 101.15 | 105.62 | 4.41 |
| Aug 21 | 102.14 | 100.80 | 104.53 | 3.71 |
| Aug 22 | 100.64 | 98.98 | 102.67 | 3.72 |
| Aug 23 | 101.25 | 100.24 | 103.01 | 2.76 |
| Aug 24 | 100.88 | 98.64 | 102.73 | 4.14 |
| Aug 25 | 102.09 | 100.16 | 104.48 | 4.31 |
| Aug 26 | 102.46 | 101.29 | 103.26 | 1.94 |
| Aug 27 | 100.46 | 99.41 | 102.69 | 3.31 |
Albemarle Daily Price Targets
Albemarle Stock Forecast 07-29-2024.
Forecast target price for 07-29-2024: $92.32.
Negative dynamics for Albemarle shares will prevail with possible volatility of 3.110%.
Pessimistic target level: 91.46
Optimistic target level: 94.40
Albemarle Stock Forecast 07-30-2024.
Forecast target price for 07-30-2024: $92.49.
Positive dynamics for Albemarle shares will prevail with possible volatility of 4.046%.
Pessimistic target level: 90.80
Optimistic target level: 94.63
Albemarle Stock Forecast 07-31-2024.
Forecast target price for 07-31-2024: $93.68.
Positive dynamics for Albemarle shares will prevail with possible volatility of 2.316%.
Pessimistic target level: 92.45
Optimistic target level: 94.64
Albemarle Stock Forecast 08-01-2024.
Forecast target price for 08-01-2024: $92.73.
Negative dynamics for Albemarle shares will prevail with possible volatility of 3.493%.
Pessimistic target level: 90.70
Optimistic target level: 93.98
Albemarle Stock Forecast 08-02-2024.
Forecast target price for 08-02-2024: $94.59.
Positive dynamics for Albemarle shares will prevail with possible volatility of 2.860%.
Pessimistic target level: 93.48
Optimistic target level: 96.24
Albemarle Stock Forecast 08-03-2024.
Forecast target price for 08-03-2024: $94.93.
Positive dynamics for Albemarle shares will prevail with possible volatility of 4.401%.
Pessimistic target level: 92.79
Optimistic target level: 97.07
ALB (ALB) Monthly Stock Prediction for 2024
| Month | Target | Pes. | Opt. | Vol., % |
|---|---|---|---|---|
| Aug. | 102.95 | 90.76 | 106.90 | 15.10 |
| Sep. | 115.96 | 106.50 | 120.97 | 11.96 |
| Oct. | 113.55 | 109.19 | 127.54 | 14.39 |
| Nov. | 118.27 | 104.08 | 131.71 | 20.98 |
| Dec. | 124.52 | 120.14 | 136.87 | 12.23 |
Albemarle forecast for this year
Albemarle Stock Prediction for Aug 2024
An uptrend is forecast for this month with an optimal target price of $102.949. Pessimistic: $90.76. Optimistic: $106.90
Albemarle Stock Prediction for Sep 2024
An uptrend is forecast for this month with an optimal target price of $115.962. Pessimistic: $106.50. Optimistic: $120.97
Albemarle Stock Prediction for Oct 2024
An downtrend is forecast for this month with an optimal target price of $113.55. Pessimistic: $109.19. Optimistic: $127.54
Albemarle Stock Prediction for Nov 2024
An uptrend is forecast for this month with an optimal target price of $118.273. Pessimistic: $104.08. Optimistic: $131.71
Albemarle Stock Prediction for Dec 2024
An uptrend is forecast for this month with an optimal target price of $124.518. Pessimistic: $120.14. Optimistic: $136.87
Albemarle (ALB) Monthly Stock Prediction for 2025
| Month | Target | Pes. | Opt. | Vol., % |
|---|---|---|---|---|
| Jan | 133.48 | 122.81 | 143.09 | 14.18 |
| Feb | 151.42 | 136.89 | 168.63 | 18.82 |
| Mar | 151.67 | 134.68 | 160.40 | 16.04 |
| Apr | 157.25 | 142.66 | 168.32 | 15.25 |
| May | 172.59 | 158.24 | 190.54 | 16.96 |
| Jun | 178.12 | 162.73 | 198.64 | 18.08 |
| Jul | 162.73 | 146.59 | 170.02 | 13.78 |
| Aug | 153.62 | 134.69 | 168.36 | 20.00 |
| Sep | 174.26 | 158.37 | 183.74 | 13.81 |
| Oct | 178.44 | 158.17 | 189.29 | 16.44 |
| Nov | 178.16 | 161.06 | 183.86 | 12.40 |
| Dec | 205.81 | 197.25 | 223.92 | 11.91 |
Albemarle (ALB) Monthly Stock Prediction for 2026
| Month | Target | Pes. | Opt. | Vol., % |
|---|---|---|---|---|
| Jan | 225.57 | 199.22 | 242.89 | 17.98 |
| Feb | 212.21 | 196.93 | 236.66 | 16.79 |
| Mar | 193.54 | 173.41 | 203.45 | 14.76 |
| Apr | 195.40 | 176.33 | 203.84 | 13.50 |
| May | 185.08 | 176.79 | 192.19 | 8.01 |
| Jun | 183.01 | 169.54 | 202.33 | 16.21 |
| Jul | 209.07 | 194.01 | 233.15 | 16.79 |
| Aug | 197.02 | 172.12 | 203.33 | 15.35 |
| Sep | 216.88 | 209.25 | 242.91 | 13.86 |
| Oct | 237.70 | 217.93 | 249.50 | 12.65 |
| Nov | 242.65 | 214.70 | 258.96 | 17.09 |
| Dec | 252.36 | 228.13 | 282.64 | 19.29 |
Albemarle (ALB) Monthly Stock Prediction for 2027
| Month | Target | Pes. | Opt. | Vol., % |
|---|---|---|---|---|
| Jan | 224.90 | 204.39 | 251.17 | 18.62 |
| Feb | 231.74 | 211.34 | 242.49 | 12.84 |
| Mar | 255.84 | 226.77 | 275.08 | 17.56 |
| Apr | 284.08 | 262.72 | 307.26 | 14.50 |
| May | 329.53 | 305.81 | 364.86 | 16.18 |
| Jun | 341.13 | 315.48 | 356.42 | 11.49 |
| Jul | 392.99 | 346.46 | 423.17 | 18.13 |
| Aug | 447.69 | 411.87 | 494.25 | 16.67 |
| Sep | 426.92 | 391.40 | 481.56 | 18.72 |
| Oct | 404.37 | 370.73 | 454.84 | 18.49 |
| Nov | 355.85 | 314.86 | 367.81 | 14.40 |
| Dec | 339.34 | 308.39 | 366.49 | 15.85 |
Albemarle (ALB) Monthly Stock Prediction for 2028
| Month | Target | Pes. | Opt. | Vol., % |
|---|---|---|---|---|
| Jan | 323.59 | 282.17 | 351.55 | 19.73 |
| Feb | 336.54 | 302.61 | 373.15 | 18.90 |
| Mar | 359.15 | 319.50 | 379.84 | 15.89 |
| Apr | 349.96 | 333.72 | 381.31 | 12.48 |
| May | 333.72 | 303.82 | 345.47 | 12.06 |
| Jun | 312.90 | 294.37 | 338.43 | 13.02 |
| Jul | 306.89 | 290.68 | 321.13 | 9.48 |
| Aug | 351.08 | 326.93 | 362.88 | 9.91 |
| Sep | 395.46 | 346.10 | 442.28 | 21.75 |
| Oct | 379.64 | 337.73 | 397.86 | 15.11 |
| Nov | 365.06 | 330.60 | 408.87 | 19.14 |
| Dec | 376.74 | 336.36 | 402.06 | 16.34 |
Albemarle information and performance
4250 CONGRESS STREET, SUITE 900, CHARLOTTE, NC, US
Market capitalization of the Albemarle Corp. is the total market value of all issued shares of a company. It is calculated by the formula multiplying the number of ALB shares in the company outstanding by the market price of one share.
EBITDA of Albemarle is earnings before interest, income tax and depreciation of assets.
P/E ratio (price to earnings) - shows the ratio between the price of a share and the company's profit
Price/earnings to growth
Dividend Per Share is a financial indicator equal to the ratio of the company's net profit available for distribution to the annual average of ordinary shares.
Dividend yield is a ratio that shows how much a company pays in dividends each year at the stock price.
EPS shows how much of the net profit is accounted for by the common share.
Trailing P/E depends on what has already been done. It uses the current share price and divides it by the total earnings per share for the last 12 months.
Forward P/E uses projections of future earnings instead of final numbers.
Enterprise Value (EV) /Revenue
The EV / EBITDA ratio shows the ratio of the cost (EV) to its profit before tax, interest and amortization (EBITDA).
Number of issued ordinary shares
Number of freely tradable shares
Shares Short Prior Month - the number of shares in short positions in the last month.
Albemarle (ALB) stock dividend
Albemarle last paid dividends on 09/13/2024. The next scheduled payment will be on 10/01/2024. The amount of dividends is $1.6 per share. If the date of the next dividend payment has not been updated, it means that the issuer has not yet announced the exact payment. As soon as information becomes available, we will immediately update the data. Bookmark our portal to stay updated.
Last Split Date: 01/01/1970
Splitting of shares is an increase in the number of securities of the issuing company circulating on the market due to a decrease in their value at constant capitalization.
For example, a 5: 1 ratio means that the value of one share will decrease 5 times, the total amount will increase 5 times. It is important to understand that this procedure does not change the capitalization of the company, as well as the total value of assets held in private hands.


