


May 1, 2024 Inflation Persistence: No Fed Rate Cuts in Sight

Taking A Closer Look At Tesla’s Cash Position


Amazon: AWS Keeps Growing With GenAI


April 23, 2024 Maximizing Profits: When is the Right Time to Sell Your Business?

April 12, 2024 Improve Your Financial Status: A How-To Guide
April 12, 2024 How ZIM Integrated Container Tracking is Revolutionizing Global Trade

March 15, 2024 6 Best Growth Stocks To Buy Now According to Metatrader 5

Bank of America (BAC) Stock Forecast for 2024–2028. Sell or Buy?
Updated: May 9, 2024 (15:08)
Sector: FinancialThe share price of Bank of America Corp. (BAC) now
50/200 Day Moving Average: $36.54 / $31.88
This figure corresponds to the Average Price over the previous 50/200 days. For Bank of America stocks, the 50-day moving average is the support level today.
For Bank of America stocks, the 200-day moving average is the support level today.
Are you interested in Bank of America Corp. stocks and want to buy them, or are they already in your portfolio? If yes, then on this page you will find useful information about the dynamics of the Bank of America stock price in 2024, 2025, 2026, 2027, 2028. How much will one Bank of America share be worth in 2024 - 2028?
When should I take profit in Bank of America stock? When should I record a loss on Bank of America stock? What are analysts' forecasts for Bank of America stock? What is the future of Bank of America stock? We forecast Bank of America stock performance using neural networks based on historical data on Bank of America stocks. Also, when forecasting, technical analysis tools are used, world geopolitical and news factors are taken into account.
Bank of America stock prediction results are shown below and presented in the form of graphs, tables and text information, divided into time intervals. (Next month, 2024, 2025, 2026, 2027 and 2028) The final quotes of the instrument at the close of the previous trading day are a signal to adjust the forecasts for Bank of America shares. This happens once a day.
Historical and forecast chart of Bank of America stock
The chart below shows the historical price of Bank of America stock and a prediction chart for the next month. For convenience, prices are divided by color. Forecast prices include: Optimistic Forecast, Pessimistic Forecast, and Weighted Average Best Forecast. Detailed values for the Bank of America stock price can be found in the table below.
Long-term forecasts by years.

Unlocking the Future of BAC Stocks: A Strategic Forecast

As we delve into the BAC stock forecast, a keen observation of several pivotal factors is crucial for accurately predicting the trajectory of Bank of America's share prices. Amongst these, financial performance, economic conditions, and market sentiment stand out as primary influencers. Their analysis provides a solid foundation for both BAC stock price prediction and decisions on buy or sell Bank of America stock.
Key Factors Steering BAC Stock Forecasts
Firstly, understanding the relationship between interest rates and BAC's profitability is essential. Analysts keenly observe rate trends, as shifts significantly impact borrowing costs and, subsequently, consumer and business lending activity. Furthermore, the broader economic conditions play a significant role. A robust economy typically signals a green light for banking stocks, enhancing the BAC stock price target. However, the converse applies in a faltering economy, demanding a strategic reassessment of whether BAC is a good stock to buy.
Additionally, the regulatory environment poses both opportunities and challenges. Regulations affecting banking operations can directly impact BAC's operational costs and services scope, influencing the BAC stock buy or sell decision. Lastly, the general market sentiment and Bank of America's financial performance remain central factors. Positive earnings reports and a bullish market elevate the Bank of America stock forecast, making BAC an attractive investment option.
In summary, by meticulously evaluating how these factors interact, analysts can forge a nuanced BAC stock price prediction, tailoring investment advice to navigate the ever-evolving financial landscape effectively.
Review the original Analysis

Bank of America Stock Forecast: Navigating Through Economic Uncertainties
In the ever-volatile world of stock trading, Bank of America (BAC) stock forecast becomes a hot topic amongst investors seeking to make informed decisions. As we delve into the intricacies of forecasting BAC stock rates, it's crucial to understand the multifaceted events and factors poised to shape its trajectory in the near future. A comprehensive analysis reveals a tapestry of elements, from revenue growth and net income challenges to evolving capital management regulations, all influencing BAC's stock price prediction.
Analysts' Lens on BAC's Future
Analysts equipped with insights into federal policies, interest rate fluctuations, and the bank's balance sheet quality are well-positioned to forecast BAC's stock movements with greater accuracy. Relying heavily on a blend of quantitative data and market sentiment, these experts sift through valuations, banking sector regulations, and economic indicators to determine whether BAC is a stock buy or sell.
In the intricate dance of forecasting, where HTM assets and quality of risk management perform their roles against the backdrop of Fed policies, one thing becomes clear: predicting Bank of America stock forecast requires a close eye on these influential factors. Whether leaning towards a buy or sell Bank of America stock decision, stakeholders acknowledge the imperative to navigate through economic uncertainties with a granular understanding of these determinants. As we venture further into 2024, these outlined factors serve as navigational beacons, leading analysts and investors to make the most accurate predictions of changes in BAC's stock price, aiming to pinpoint an ideal BAC stock price target.
In conclusion, as we wade through an era of financial complexities, the pursuit to demystify is BAC a good stock to buy continues. With the right analytical tools and a keen eye on unfolding economic narratives, the forecast for BAC stock rates turns less into a gamble and more into a calculated venture.
Review the original Analysis

Unlocking the Future: Bank of America's Stock Forecast Unveiled

In the ever-evolving landscape of the financial markets, keeping a keen eye on the predictors of stock rate changes is crucial for investors. For those turning their gaze towards Bank of America (BAC), a detailed analysis reveals several pivotal factors set to influence its stock trajectory. As we dive into the dynamics shaping the BAC stock forecast, understanding these elements becomes paramount for making informed decisions.
Navigating the Waters: Key Influencers on BAC's Horizon
At the forefront of these influencing factors is Bank of America's financial performance, including its Q1 results which showcased an uptick in net interest income coupled with a reduction in non-interest expenses. Such strong performance signals not only the bank's robust health but also acts as a beacon for investors, potentially buoying the BAC stock price prediction.
Additionally, the allure of BAC's preferred dividends cannot be overstated. Offering a beacon of stability, these dividends represent a safe harbor for income-focused investors, further cementing BAC's appeal. Amid the complexities of the market, the reliability of these dividends, especially the Series L "Busted" and Series HH preferred shares, stands out. With yields hovering around 6-6.25%, these assets not only offer attractive returns but also underscore the bank's financial solidity.
However, it's not just about the gains but also the gauging of risks, such as the FDIC special assessment's impact on net income. While a challenge, the minimal effect on preferred dividends suggests resilience, offering a layer of reassurance for those pondering 'BAC stock buy or sell.'
- Financial Performance: A beacon for predicting BAC stock forecast.
- Preferred Dividends: The cornerstone for 'is BAC a good stock to buy.'
- Series HH and L Preferred Shares: High-yield harbors in the investment sea.
- FDIC Special Assessment: A minor tempest with limited impact on investor confidence.
By putting a magnifying glass on these factors, analysts can craft a more accurate Bank of America stock forecast. Whether it’s gauging the attractiveness of BAC's preferred shares or evaluating the bank's financial health, these elements provide a roadmap. For investors debating 'buy or sell Bank of America stock,' understanding these dynamics offers a guiding light towards making data-driven decisions in the pursuit of favorable returns.
Review the original Analysis
- Bank of America successfully adapted its business model by using some assets from the 2008 Federal Reserve aid package, which are now part of the bank’s subsidiaries.
- Mark-to-market valuations have negligible impacts on its operations as long as it holds on to securities until they mature and assumes constant operations. On the downside, “mark-to-market” symbolizes an opportunity cost that companies need to embrace for assured future gains.
- The bank principally focuses on managing incoming and outgoing cash flows to yield profits. It doesn’t excessively worry about unpredictable market conditions.
BAC is set to make significant financial gains as the ill-conceived, held-to-maturity securities that have been generating losses eventually roll off. The stock right now upgrades to a ‘Buy’ rating with an anticipated 7%-9% annual return over the long haul.
The stock has been performing admirably, even outpacing both the broader S&P 500 (SPY) and the illustrious “Magnificent 7”.
So what’s fueling these returns?
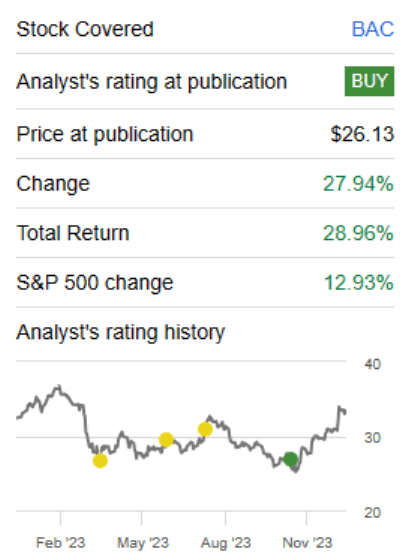
A whopping 29% total return over three months might lead you to believe that BAC has either reinvented some financial mechanism or tapped into the lucrative AI market. But far from it. The reality is that earnings estimates have seen a reluctant dip in the past month.
What’s really driving this is essentially market risk for a harsh recession being priced out. There are plenty of metrics you could consider for this, but Baa corporate bond yields (that teeter on investment-grade) and their spreads to US Treasuries have served as a terrific reverse indicator for BAC stock.
Given that yield is nearing its year-long low, you’d need to start questioning your future predictions for this and other risk factors.
About the Company
Bank of America is an international corporation operating in 35 countries. The company has 213,000 employees, 16,000 ATMs and 4,700 offices across America. It is engaged in three areas: lending to individuals and servicing their accounts; helping corporations manage assets; and trading on currency, stock, and commodity exchanges.
In 2015, Forbes ranked Bank of America as the twenty-third largest company in the world. In 2016, the bank became the largest in the United States in terms of assets. In 2016, the company earned $ 83.7 billion.
The company has been around since 1904, when Amadeo Giannini founded the Bank of Italy in San Francisco. Bank Giannini was different from other banks of the early 20th century: it had 100 branches, which served the middle class and immigrants – other banks in the city did not give them loans. After the 1906 earthquake, the Bank of Italy retained its building and money, unlike other banks. Giannini took advantage of the saved resources and began issuing recovery loans a few days after the disaster. In 1929 Bank of Italy merged with Los Angeles-based Bank of America. The United Bank received the name of the latter.
Bank of America daily forecast for a month
| Date | Target | Pes. | Opt. | Vol., % |
|---|---|---|---|---|
| May 11 | 37.10 | 36.34 | 37.75 | 3.86 |
| May 12 | 37.43 | 37.06 | 38.27 | 3.24 |
| May 13 | 37.64 | 36.99 | 37.89 | 2.41 |
| May 14 | 38.11 | 37.56 | 38.36 | 2.13 |
| May 15 | 38.03 | 37.53 | 38.84 | 3.50 |
| May 16 | 38.92 | 38.37 | 39.18 | 2.10 |
| May 17 | 39.15 | 38.81 | 39.85 | 2.66 |
| May 18 | 39.12 | 38.49 | 39.95 | 3.81 |
| May 19 | 40.27 | 39.80 | 40.83 | 2.58 |
| May 20 | 39.57 | 38.68 | 40.39 | 4.42 |
| May 21 | 38.64 | 37.85 | 39.44 | 4.20 |
| May 22 | 39.67 | 38.85 | 40.38 | 3.92 |
| May 23 | 39.78 | 38.92 | 40.52 | 4.11 |
| May 24 | 40.77 | 40.01 | 41.74 | 4.31 |
| May 25 | 41.75 | 41.49 | 42.24 | 1.81 |
| May 26 | 42.23 | 41.31 | 42.49 | 2.85 |
| May 27 | 42.73 | 42.37 | 43.13 | 1.79 |
| May 28 | 43.72 | 43.37 | 44.74 | 3.18 |
| May 29 | 42.74 | 42.47 | 43.26 | 1.87 |
| May 30 | 42.37 | 41.48 | 43.24 | 4.26 |
| May 31 | 42.17 | 41.47 | 42.64 | 2.84 |
| Jun 01 | 41.01 | 40.24 | 41.86 | 4.04 |
| Jun 02 | 41.31 | 40.40 | 41.86 | 3.62 |
| Jun 03 | 41.54 | 41.17 | 42.40 | 3.00 |
| Jun 04 | 41.85 | 40.92 | 42.42 | 3.65 |
| Jun 05 | 41.44 | 41.08 | 42.36 | 3.12 |
| Jun 06 | 40.32 | 39.65 | 41.00 | 3.39 |
| Jun 07 | 40.40 | 39.51 | 40.77 | 3.19 |
| Jun 08 | 39.69 | 38.95 | 40.21 | 3.24 |
| Jun 09 | 38.55 | 37.98 | 39.38 | 3.68 |
Bank of America Daily Price Targets
Bank of America Stock Forecast 05-11-2024.
Forecast target price for 05-11-2024: $37.10.
Negative dynamics for Bank of America shares will prevail with possible volatility of 3.715%.
Pessimistic target level: 36.34
Optimistic target level: 37.75
Bank of America Stock Forecast 05-12-2024.
Forecast target price for 05-12-2024: $37.43.
Positive dynamics for Bank of America shares will prevail with possible volatility of 3.140%.
Pessimistic target level: 37.06
Optimistic target level: 38.27
Bank of America Stock Forecast 05-13-2024.
Forecast target price for 05-13-2024: $37.64.
Positive dynamics for Bank of America shares will prevail with possible volatility of 2.354%.
Pessimistic target level: 36.99
Optimistic target level: 37.89
Bank of America Stock Forecast 05-14-2024.
Forecast target price for 05-14-2024: $38.11.
Positive dynamics for Bank of America shares will prevail with possible volatility of 2.086%.
Pessimistic target level: 37.56
Optimistic target level: 38.36
Bank of America Stock Forecast 05-15-2024.
Forecast target price for 05-15-2024: $38.03.
Negative dynamics for Bank of America shares will prevail with possible volatility of 3.378%.
Pessimistic target level: 37.53
Optimistic target level: 38.84
Bank of America Stock Forecast 05-16-2024.
Forecast target price for 05-16-2024: $38.92.
Positive dynamics for Bank of America shares will prevail with possible volatility of 2.057%.
Pessimistic target level: 38.37
Optimistic target level: 39.18
BAC (BAC) Monthly Stock Prediction for 2024
| Month | Target | Pes. | Opt. | Vol., % |
|---|---|---|---|---|
| Jun. | 37.39 | 36.74 | 38.04 | 3.44 |
| Jul. | 39.33 | 38.69 | 40.10 | 3.50 |
| Aug. | 40.37 | 38.42 | 42.49 | 9.58 |
| Sep. | 40.85 | 39.48 | 42.65 | 7.44 |
| Oct. | 41.51 | 40.09 | 42.93 | 6.63 |
| Nov. | 43.05 | 40.88 | 43.71 | 6.48 |
| Dec. | 44.23 | 43.14 | 45.34 | 4.85 |
Bank of America forecast for this year
Bank of America Stock Prediction for Jun 2024
An downtrend is forecast for this month with an optimal target price of $37.3897. Pessimistic: $36.74. Optimistic: $38.04
Bank of America Stock Prediction for Jul 2024
An uptrend is forecast for this month with an optimal target price of $39.3265. Pessimistic: $38.69. Optimistic: $40.10
Bank of America Stock Prediction for Aug 2024
An uptrend is forecast for this month with an optimal target price of $40.3726. Pessimistic: $38.42. Optimistic: $42.49
Bank of America Stock Prediction for Sep 2024
An uptrend is forecast for this month with an optimal target price of $40.853. Pessimistic: $39.48. Optimistic: $42.65
Bank of America Stock Prediction for Oct 2024
An uptrend is forecast for this month with an optimal target price of $41.5107. Pessimistic: $40.09. Optimistic: $42.93
Bank of America Stock Prediction for Nov 2024
An uptrend is forecast for this month with an optimal target price of $43.0508. Pessimistic: $40.88. Optimistic: $43.71
Bank of America Stock Prediction for Dec 2024
An uptrend is forecast for this month with an optimal target price of $44.2261. Pessimistic: $43.14. Optimistic: $45.34
Bank of America (BAC) Monthly Stock Prediction for 2025
| Month | Target | Pes. | Opt. | Vol., % |
|---|---|---|---|---|
| Jan | 44.60 | 42.79 | 45.97 | 6.93 |
| Feb | 45.66 | 44.35 | 46.87 | 5.39 |
| Mar | 45.53 | 43.87 | 46.30 | 5.23 |
| Apr | 44.51 | 43.70 | 46.94 | 6.90 |
| May | 41.49 | 39.37 | 43.70 | 9.90 |
| Jun | 44.02 | 43.03 | 44.79 | 3.92 |
| Jul | 44.57 | 43.88 | 46.50 | 5.64 |
| Aug | 47.41 | 45.58 | 48.47 | 5.96 |
| Sep | 46.85 | 45.83 | 48.78 | 6.05 |
| Oct | 47.53 | 45.20 | 49.16 | 8.05 |
| Nov | 48.13 | 47.43 | 50.52 | 6.13 |
| Dec | 48.98 | 48.05 | 50.96 | 5.72 |
Bank of America (BAC) Monthly Stock Prediction for 2026
| Month | Target | Pes. | Opt. | Vol., % |
|---|---|---|---|---|
| Jan | 45.89 | 45.22 | 48.17 | 6.14 |
| Feb | 44.86 | 42.69 | 46.09 | 7.36 |
| Mar | 45.74 | 44.72 | 48.14 | 7.12 |
| Apr | 43.60 | 41.37 | 45.67 | 9.42 |
| May | 42.19 | 39.83 | 43.99 | 9.47 |
| Jun | 42.31 | 40.12 | 43.44 | 7.64 |
| Jul | 44.56 | 42.22 | 45.96 | 8.14 |
| Aug | 43.56 | 41.76 | 45.15 | 7.50 |
| Sep | 40.79 | 38.99 | 42.44 | 8.14 |
| Oct | 41.47 | 39.18 | 43.77 | 10.48 |
| Nov | 40.31 | 39.04 | 40.88 | 4.49 |
| Dec | 38.17 | 37.63 | 38.70 | 2.76 |
Bank of America (BAC) Monthly Stock Prediction for 2027
| Month | Target | Pes. | Opt. | Vol., % |
|---|---|---|---|---|
| Jan | 39.61 | 38.81 | 41.30 | 6.04 |
| Feb | 41.47 | 40.28 | 42.83 | 5.96 |
| Mar | 40.63 | 39.09 | 41.79 | 6.46 |
| Apr | 42.79 | 40.72 | 44.43 | 8.36 |
| May | 43.78 | 42.80 | 45.03 | 4.97 |
| Jun | 43.07 | 41.74 | 45.39 | 8.04 |
| Jul | 43.37 | 41.25 | 43.98 | 6.21 |
| Aug | 42.80 | 41.06 | 43.66 | 5.97 |
| Sep | 40.46 | 39.64 | 42.64 | 7.04 |
| Oct | 38.28 | 37.42 | 39.89 | 6.18 |
| Nov | 37.21 | 35.23 | 39.24 | 10.22 |
| Dec | 37.54 | 36.78 | 38.28 | 3.91 |
Bank of America (BAC) Monthly Stock Prediction for 2028
| Month | Target | Pes. | Opt. | Vol., % |
|---|---|---|---|---|
| Jan | 38.04 | 36.98 | 39.43 | 6.21 |
| Feb | 40.47 | 39.48 | 41.88 | 5.75 |
| Mar | 39.76 | 37.62 | 41.23 | 8.77 |
| Apr | 41.62 | 40.84 | 43.14 | 5.34 |
| May | 41.62 | 39.64 | 43.29 | 8.41 |
| Jun | 43.63 | 42.93 | 45.86 | 6.39 |
| Jul | 44.92 | 42.62 | 46.77 | 8.87 |
| Aug | 44.35 | 43.05 | 46.28 | 6.98 |
| Sep | 43.14 | 41.87 | 45.10 | 7.16 |
| Oct | 42.66 | 41.52 | 43.52 | 4.60 |
| Nov | 40.84 | 38.98 | 42.21 | 7.65 |
| Dec | 38.69 | 36.90 | 40.10 | 7.97 |
Bank of America information and performance
BANK OF AMERICA CORPORATE CENTER, 100 N TRYON ST, CHARLOTTE, NC, US
Market capitalization of the Bank of America Corp. is the total market value of all issued shares of a company. It is calculated by the formula multiplying the number of BAC shares in the company outstanding by the market price of one share.
EBITDA of Bank of America is earnings before interest, income tax and depreciation of assets.
P/E ratio (price to earnings) - shows the ratio between the price of a share and the company's profit
Price/earnings to growth
Dividend Per Share is a financial indicator equal to the ratio of the company's net profit available for distribution to the annual average of ordinary shares.
Dividend yield is a ratio that shows how much a company pays in dividends each year at the stock price.
EPS shows how much of the net profit is accounted for by the common share.
Trailing P/E depends on what has already been done. It uses the current share price and divides it by the total earnings per share for the last 12 months.
Forward P/E uses projections of future earnings instead of final numbers.
Enterprise Value (EV) /Revenue
The EV / EBITDA ratio shows the ratio of the cost (EV) to its profit before tax, interest and amortization (EBITDA).
Number of issued ordinary shares
Number of freely tradable shares
Shares Short Prior Month - the number of shares in short positions in the last month.
Bank of America (BAC) stock dividend
Bank of America last paid dividends on 06/07/2024. The next scheduled payment will be on 06/28/2024. The amount of dividends is $0.94 per share. If the date of the next dividend payment has not been updated, it means that the issuer has not yet announced the exact payment. As soon as information becomes available, we will immediately update the data. Bookmark our portal to stay updated.
Last Split Date: 01/01/1970
Splitting of shares is an increase in the number of securities of the issuing company circulating on the market due to a decrease in their value at constant capitalization.
For example, a 5: 1 ratio means that the value of one share will decrease 5 times, the total amount will increase 5 times. It is important to understand that this procedure does not change the capitalization of the company, as well as the total value of assets held in private hands.


