


A.O. Smith: Great Company, Inferior Investment


April 23, 2024 Maximizing Profits: When is the Right Time to Sell Your Business?

April 12, 2024 Improve Your Financial Status: A How-To Guide
April 12, 2024 How ZIM Integrated Container Tracking is Revolutionizing Global Trade

March 15, 2024 6 Best Growth Stocks To Buy Now According to Metatrader 5

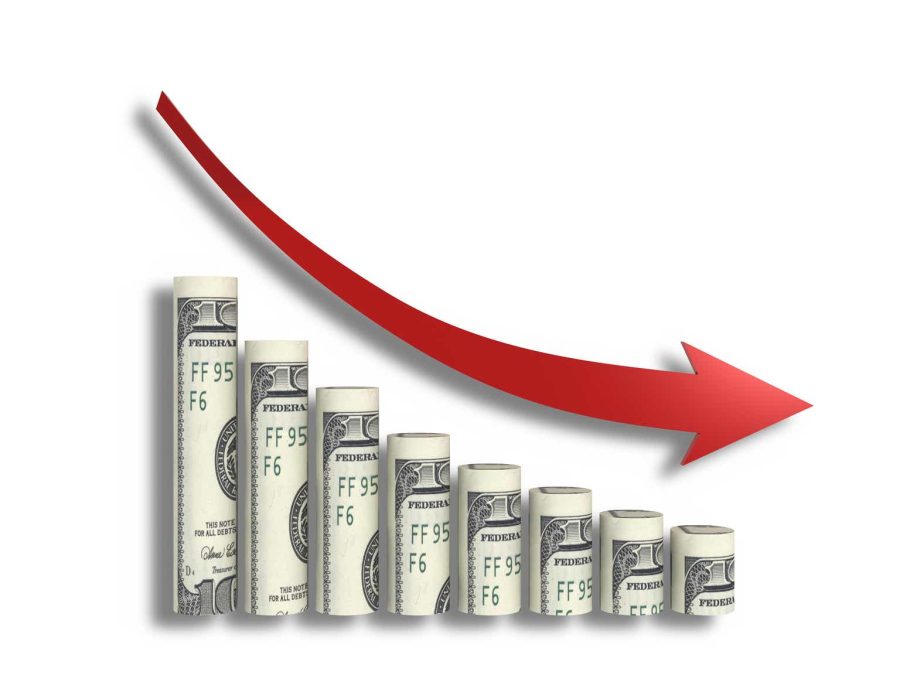
QUALCOMM (QCOM) Stock Forecast for 2024–2028. Sell or Buy?
Updated: May 20, 2024 (03:24)
Sector: TechnologyThe share price of QUALCOMM, Inc. (QCOM) now
50/200 Day Moving Average: $172.23 / $139.56
This figure corresponds to the Average Price over the previous 50/200 days. For QUALCOMM stocks, the 50-day moving average is the support level today.
For QUALCOMM stocks, the 200-day moving average is the support level today.
Are you interested in QUALCOMM, Inc. stocks and want to buy them, or are they already in your portfolio? If yes, then on this page you will find useful information about the dynamics of the QUALCOMM stock price in 2024, 2025, 2026, 2027, 2028. How much will one QUALCOMM share be worth in 2024 - 2028?
When should I take profit in QUALCOMM stock? When should I record a loss on QUALCOMM stock? What are analysts' forecasts for QUALCOMM stock? What is the future of QUALCOMM stock? We forecast QUALCOMM stock performance using neural networks based on historical data on QUALCOMM stocks. Also, when forecasting, technical analysis tools are used, world geopolitical and news factors are taken into account.
QUALCOMM stock prediction results are shown below and presented in the form of graphs, tables and text information, divided into time intervals. (Next month, 2024, 2025, 2026, 2027 and 2028) The final quotes of the instrument at the close of the previous trading day are a signal to adjust the forecasts for QUALCOMM shares. This happens once a day.
Historical and forecast chart of QUALCOMM stock
The chart below shows the historical price of QUALCOMM stock and a prediction chart for the next month. For convenience, prices are divided by color. Forecast prices include: Optimistic Forecast, Pessimistic Forecast, and Weighted Average Best Forecast. Detailed values for the QUALCOMM stock price can be found in the table below.
Long-term forecasts by years.
Qualcomm's Stock Forecast: Navigating the Winds of Change

The dynamic landscape of the tech industry brings forth various factors that are pivotal in shaping the future trajectory of Qualcomm's (QCOM) stock rates. Among these, government restrictions on hi-tech equipment and export licenses emerge as a primary concern. This crackdown, primarily targeting China's semiconductor industry, holds the potential to significantly hamper Qualcomm's business in the region, which represents over 40% of its revenues. This poses a sizable threat, bringing to the forefront the need for precise stock price prediction analysis for investors eyeing the QUALCOMM stock forecast.
Peering Through the Competitive Lens
Another factor casting a shadow over the QCOM stock forecast is the rising competition from Chinese companies like Huawei and Unisoc. These entities are not just contenders but formidable adversaries that are fast developing their own chip technologies. This competition is critical in analyzing the QCOM stock buy or sell conundrum, as it can potentially erode Qualcomm’s market share, thereby affecting its stock price. Moreover, the changing dynamics of Western brand sales in China, especially those like Apple which embed Qualcomm's chips in their devices, further complicate the stock price prediction.
To navigate these choppy waters, analysts aiming for the most accurate QCOM stock price prediction must closely monitor these evolving scenarios. Understanding how Qualcomm plans to diversify its revenue streams, particularly through expansion into alternative markets such as AIoT, could be the keystone in offsetting potential losses in China. Thus, for anyone pondering, "is QCOM a good stock to buy?", closely observing these facets and their developments can offer crucial insights.
- Government restrictions on hi-tech exports
- Rising competition from Chinese firms
- Slumping sales of Western brands in China
- Qualcomm’s expansion into new markets
Factoring in these elements into the QUALCOMM stock forecast could help analysts and investors alike make more informed decisions regarding whether QCOM stock is a buy or sell, steering through speculation towards more grounded QCOM stock price predictions and targets.
Review the original Analysis
Anticipating QCOM's Bright Future Amidst Market Rebounds and Strategic Partnerships

Analysts looking into the crystal ball to forecast the trajectory of QCOM stocks are presented with a complex tapestry woven with various influential factors. In the near future, a confluence of critical events and dynamics is set to significantly influence the ebb and flow of QCOM stock rates. Central among these is the anticipated rebound in smartphones and consumer electronics. With the market, especially in China, showing signs of vigorous revival, Qualcomm stands poised to benefit immensely. The company's pivotal role as a supplier of chips to this sector underscores the magnitude of impact this rebound could have on its financial health and stock valuation.
Making Informed Predictions: Beyond the Surface
An intricate understanding of Qualcomm's strategic positioning unveils other potential levers of growth. The burgeoning automotive business, fueled by Qualcomm's market share gains in automotive chips, presents a lucrative frontier. Analysts can weave this factor into a QCOM stock forecast, imagining a horizon where digital cockpits and connectivity assume center stage. Additionally, the company's entrenchment with behemoths like Samsung and an array of Chinese manufacturers stand as testament to its market permeation—factors that can't be overlooked when considering a QCOM stock buy or sell decision.
However, predicting the future is an art dressed as science. Aside from the palpable opportunities, potential risks such as governmental restrictions, vertical integration by customers, and legal entanglements loom as dark clouds. Incorporating these aspects into a QUALCOMM stock forecast requires a blend of analytical rigor and industry intuition. As we ponder over whether QCOM is a good stock to buy, it's crucial to balance the prospects against the vulnerabilities.
In conclusion, engulfed in the dynamics of market demand, strategic partnerships, and innovation, the prediction of QCOM stock price targets involves deciphering a complex matrix of factors. Analysts equipped with a comprehensive understanding of these elements are better positioned to make accurate forecasts, delineating a future where QCOM not merely survives but thrives.
Review the original Analysis
Unlocking the Future: QCOM Stock's AI-Driven Surge

The bustling landscape of Qualcomm's stock (QCOM) presents an intriguing scenario for investors and analysts aiming to predict future trends. The crux of QCOM's potential stock rate changes hinges on a few pivotal factors that spell out a remarkably compelling narrative. Analysts considering the QCOM stock forecast or determining whether QCOM stock is a buy or sell must pierce through the heart of these dynamics.
Forecasting the AI Revolution in Qualcomm's Horizon
Foremost, the surge in investor optimism, notably influenced by Qualcomm's pioneering advancements in AI and its strategic recovery in the Chinese market, serves as a linchpin for the company's stock revaluation. This investor enthusiasm, notably towards Qualcomm's role in the burgeoning AI smartphone upgrade cycle, suggests an optimistic QUALCOMM stock forecast. The zeal for advanced AI capabilities in smartphones underscores a voracious market appetite where Qualcomm's cutting-edge chipsets and neural processing units (NPUs) are poised to dominate. It's this AI-led transformation that should be at the forefront of any analyst's QCOM stock price prediction.
Furthermore, Qualcomm's foray into diversifying its revenue streams—spanning from PC to automotive, and IoT—adds another layer of potential uplift to the QCOM stock price target. While the smartphone chipset business remains a significant driver, the promising trajectory in the automotive segment, aiming for $4 billion in revenue by FY2026, amplifies the rationale for considering QCOM a good stock to buy.
Analysts looking to navigate the Qualcomm stock forecast maze would do well by prioritizing these elements in their analysis:
- Investor optimism and market revaluation due to AI advancements and market recovery in China.
- The AI smartphone upgrade cycle's impact on the market demand for Qualcomm's technologies.
- Revenue diversification efforts, especially in the automotive sector, that broaden Qualcomm's growth outlook.
By calibrating focus on these areas, analysts can forge more accurate and dynamic predictions, paving the way for informed decisions on whether to buy or sell QUALCOMM stock.
Review the original Analysis
Qualcomm is an American multinational company that develops and markets wireless telecommunications products and services, as well as systems on a chip. The main part of the company’s income comes from the production of microcircuits and the licensing of business patents. “We are doing what many thought was impossible,” – that’s what Qualcomm says about their business. Since 1991, the company has been involved in the development of Globalstar, a satellite system. The system is used for voice telephony using satellite phones, data transmission using mobile satellite modems.
Pioneers in the commercialization of the CDMAOne (IS-95) wireless standard, and then CDMA2000, an early (3G) communication standard for the third generation of mobile phones, it is also famous for its microprocessors developed and integrated into mobile phones. They are used by such famous companies as Kyocera, HTC Corporation, Motorola, Sharp, Sanyo, LG, Microsoft, Sony and Samsung.
In July 1985, Dr. Irwin M. Jacobs, Dr. Andrew Viterbi, Harvey White, Franklin Antonio, Andrew Cohen, Klein Gilhousen, and Adelia Coffman founded and opened the company’s first office in La Jolla, California. In the same year, the firm won its first contract and began working with CDMA, a unique digital wireless technology used by the US military for secure communications. In December 1991, Qualcomm makes its first public offering. In 2012, it introduced its first generation Wi-Fi® Display with peer-to-peer support. It is the first solution that will serve as the foundation for the next generation of interoperable consumer electronics, allowing users to easily share content between devices, without the need for an Internet connection, network or other access point.

QUALCOMM daily forecast for a month
| Date | Target | Pes. | Opt. | Vol., % |
|---|---|---|---|---|
| May 22 | 190.04 | 188.90 | 193.69 | 2.54 |
| May 23 | 192.43 | 189.78 | 194.45 | 2.46 |
| May 24 | 193.18 | 190.81 | 195.97 | 2.70 |
| May 25 | 195.62 | 193.51 | 199.20 | 2.94 |
| May 26 | 198.73 | 197.12 | 203.26 | 3.11 |
| May 27 | 198.43 | 197.18 | 203.07 | 2.99 |
| May 28 | 201.23 | 197.30 | 202.86 | 2.81 |
| May 29 | 201.83 | 200.38 | 203.83 | 1.72 |
| May 30 | 197.05 | 195.63 | 200.71 | 2.60 |
| May 31 | 197.46 | 195.51 | 201.14 | 2.88 |
| Jun 01 | 191.89 | 189.42 | 193.62 | 2.22 |
| Jun 02 | 189.02 | 186.92 | 193.55 | 3.55 |
| Jun 03 | 192.30 | 190.11 | 196.11 | 3.16 |
| Jun 04 | 193.57 | 191.54 | 197.12 | 2.91 |
| Jun 05 | 197.23 | 194.57 | 201.49 | 3.56 |
| Jun 06 | 202.79 | 201.21 | 206.57 | 2.66 |
| Jun 07 | 201.52 | 199.22 | 206.17 | 3.49 |
| Jun 08 | 205.69 | 201.31 | 207.97 | 3.31 |
| Jun 09 | 205.75 | 203.47 | 210.19 | 3.31 |
| Jun 10 | 206.06 | 203.77 | 209.52 | 2.82 |
| Jun 11 | 204.57 | 199.85 | 206.35 | 3.25 |
| Jun 12 | 200.34 | 196.85 | 203.83 | 3.54 |
| Jun 13 | 198.42 | 196.63 | 201.33 | 2.39 |
| Jun 14 | 198.89 | 196.03 | 203.31 | 3.71 |
| Jun 15 | 204.26 | 199.73 | 207.27 | 3.77 |
| Jun 16 | 204.32 | 200.22 | 209.17 | 4.47 |
| Jun 17 | 205.12 | 201.80 | 209.55 | 3.84 |
| Jun 18 | 199.83 | 196.23 | 204.03 | 3.97 |
| Jun 19 | 195.03 | 190.88 | 197.14 | 3.28 |
| Jun 20 | 193.69 | 190.90 | 194.97 | 2.13 |
QUALCOMM Daily Price Targets
QUALCOMM Stock Forecast 05-22-2024.
Forecast target price for 05-22-2024: $190.04.
Negative dynamics for QUALCOMM shares will prevail with possible volatility of 2.473%.
Pessimistic target level: 188.90
Optimistic target level: 193.69
QUALCOMM Stock Forecast 05-23-2024.
Forecast target price for 05-23-2024: $192.43.
Positive dynamics for QUALCOMM shares will prevail with possible volatility of 2.405%.
Pessimistic target level: 189.78
Optimistic target level: 194.45
QUALCOMM Stock Forecast 05-24-2024.
Forecast target price for 05-24-2024: $193.18.
Positive dynamics for QUALCOMM shares will prevail with possible volatility of 2.632%.
Pessimistic target level: 190.81
Optimistic target level: 195.97
QUALCOMM Stock Forecast 05-25-2024.
Forecast target price for 05-25-2024: $195.62.
Positive dynamics for QUALCOMM shares will prevail with possible volatility of 2.858%.
Pessimistic target level: 193.51
Optimistic target level: 199.20
QUALCOMM Stock Forecast 05-26-2024.
Forecast target price for 05-26-2024: $198.73.
Positive dynamics for QUALCOMM shares will prevail with possible volatility of 3.021%.
Pessimistic target level: 197.12
Optimistic target level: 203.26
QUALCOMM Stock Forecast 05-27-2024.
Forecast target price for 05-27-2024: $198.43.
Negative dynamics for QUALCOMM shares will prevail with possible volatility of 2.902%.
Pessimistic target level: 197.18
Optimistic target level: 203.07
QCOM (QCOM) Monthly Stock Prediction for 2024
| Month | Target | Pes. | Opt. | Vol., % |
|---|---|---|---|---|
| Jun. | 212.04 | 193.94 | 223.03 | 13.04 |
| Jul. | 226.89 | 219.58 | 233.88 | 6.11 |
| Aug. | 240.23 | 215.68 | 265.45 | 18.75 |
| Sep. | 238.55 | 225.86 | 253.91 | 11.05 |
| Oct. | 212.83 | 200.32 | 230.11 | 12.95 |
| Nov. | 236.37 | 222.80 | 245.97 | 9.42 |
| Dec. | 238.69 | 222.31 | 255.73 | 13.07 |
QUALCOMM forecast for this year
QUALCOMM Stock Prediction for Jun 2024
An uptrend is forecast for this month with an optimal target price of $212.044. Pessimistic: $193.94. Optimistic: $223.03
QUALCOMM Stock Prediction for Jul 2024
An uptrend is forecast for this month with an optimal target price of $226.887. Pessimistic: $219.58. Optimistic: $233.88
QUALCOMM Stock Prediction for Aug 2024
An uptrend is forecast for this month with an optimal target price of $240.228. Pessimistic: $215.68. Optimistic: $265.45
QUALCOMM Stock Prediction for Sep 2024
An downtrend is forecast for this month with an optimal target price of $238.547. Pessimistic: $225.86. Optimistic: $253.91
QUALCOMM Stock Prediction for Oct 2024
An downtrend is forecast for this month with an optimal target price of $212.831. Pessimistic: $200.32. Optimistic: $230.11
QUALCOMM Stock Prediction for Nov 2024
An uptrend is forecast for this month with an optimal target price of $236.37. Pessimistic: $222.80. Optimistic: $245.97
QUALCOMM Stock Prediction for Dec 2024
An uptrend is forecast for this month with an optimal target price of $238.687. Pessimistic: $222.31. Optimistic: $255.73
QUALCOMM (QCOM) Monthly Stock Prediction for 2025
| Month | Target | Pes. | Opt. | Vol., % |
|---|---|---|---|---|
| Jan | 250.72 | 243.70 | 271.78 | 10.33 |
| Feb | 258.44 | 230.94 | 276.53 | 16.49 |
| Mar | 251.56 | 242.41 | 278.68 | 13.02 |
| Apr | 221.28 | 211.67 | 238.00 | 11.06 |
| May | 220.04 | 198.17 | 243.76 | 18.70 |
| Jun | 230.82 | 223.71 | 254.09 | 11.96 |
| Jul | 250.21 | 237.60 | 277.53 | 14.39 |
| Aug | 276.83 | 252.41 | 287.68 | 12.26 |
| Sep | 269.47 | 243.06 | 298.51 | 18.58 |
| Oct | 268.71 | 243.51 | 292.04 | 16.62 |
| Nov | 271.35 | 254.63 | 292.62 | 12.98 |
| Dec | 275.90 | 250.80 | 302.17 | 17.00 |
QUALCOMM (QCOM) Monthly Stock Prediction for 2026
| Month | Target | Pes. | Opt. | Vol., % |
|---|---|---|---|---|
| Jan | 263.93 | 239.54 | 273.54 | 12.43 |
| Feb | 241.76 | 225.17 | 261.39 | 13.86 |
| Mar | 246.50 | 221.65 | 264.79 | 16.29 |
| Apr | 247.53 | 220.16 | 259.66 | 15.21 |
| May | 242.33 | 223.34 | 264.73 | 15.64 |
| Jun | 231.48 | 219.49 | 240.55 | 8.76 |
| Jul | 219.81 | 201.04 | 242.89 | 17.23 |
| Aug | 211.20 | 203.21 | 221.54 | 8.27 |
| Sep | 195.82 | 180.74 | 212.82 | 15.07 |
| Oct | 205.96 | 197.60 | 223.26 | 11.49 |
| Nov | 188.37 | 174.40 | 196.55 | 11.27 |
| Dec | 177.03 | 169.85 | 196.12 | 13.40 |
QUALCOMM (QCOM) Monthly Stock Prediction for 2027
| Month | Target | Pes. | Opt. | Vol., % |
|---|---|---|---|---|
| Jan | 198.60 | 192.48 | 206.66 | 6.86 |
| Feb | 202.49 | 193.42 | 215.81 | 10.38 |
| Mar | 203.34 | 189.39 | 215.58 | 12.15 |
| Apr | 195.65 | 186.61 | 209.90 | 11.09 |
| May | 190.18 | 170.21 | 201.36 | 15.47 |
| Jun | 186.98 | 181.75 | 206.09 | 11.81 |
| Jul | 181.48 | 165.22 | 193.17 | 14.47 |
| Aug | 192.92 | 183.19 | 200.75 | 8.75 |
| Sep | 179.95 | 163.83 | 186.50 | 12.16 |
| Oct | 158.79 | 143.67 | 168.79 | 14.88 |
| Nov | 150.12 | 134.36 | 159.16 | 15.58 |
| Dec | 153.90 | 138.82 | 160.80 | 13.67 |
QUALCOMM (QCOM) Monthly Stock Prediction for 2028
| Month | Target | Pes. | Opt. | Vol., % |
|---|---|---|---|---|
| Jan | 171.36 | 157.20 | 186.23 | 15.59 |
| Feb | 172.08 | 162.92 | 185.08 | 11.97 |
| Mar | 173.04 | 168.19 | 185.15 | 9.16 |
| Apr | 189.27 | 180.53 | 197.48 | 8.59 |
| May | 194.57 | 188.58 | 207.65 | 9.18 |
| Jun | 202.74 | 181.17 | 210.69 | 14.01 |
| Jul | 199.62 | 193.75 | 212.75 | 8.93 |
| Aug | 211.64 | 198.01 | 223.19 | 11.28 |
| Sep | 208.08 | 186.82 | 215.07 | 13.14 |
| Oct | 202.84 | 189.49 | 216.75 | 12.58 |
| Nov | 178.42 | 163.93 | 194.65 | 15.78 |
| Dec | 162.18 | 153.33 | 168.31 | 8.90 |
QUALCOMM information and performance
5775 MOREHOUSE DR, SAN DIEGO, CA, US
Market capitalization of the QUALCOMM, Inc. is the total market value of all issued shares of a company. It is calculated by the formula multiplying the number of QCOM shares in the company outstanding by the market price of one share.
EBITDA of QUALCOMM is earnings before interest, income tax and depreciation of assets.
P/E ratio (price to earnings) - shows the ratio between the price of a share and the company's profit
Price/earnings to growth
Dividend Per Share is a financial indicator equal to the ratio of the company's net profit available for distribution to the annual average of ordinary shares.
Dividend yield is a ratio that shows how much a company pays in dividends each year at the stock price.
EPS shows how much of the net profit is accounted for by the common share.
Trailing P/E depends on what has already been done. It uses the current share price and divides it by the total earnings per share for the last 12 months.
Forward P/E uses projections of future earnings instead of final numbers.
Enterprise Value (EV) /Revenue
The EV / EBITDA ratio shows the ratio of the cost (EV) to its profit before tax, interest and amortization (EBITDA).
Number of issued ordinary shares
Number of freely tradable shares
Shares Short Prior Month - the number of shares in short positions in the last month.
QUALCOMM (QCOM) stock dividend
QUALCOMM last paid dividends on 05/30/2024. The next scheduled payment will be on 06/20/2024. The amount of dividends is $3.2 per share. If the date of the next dividend payment has not been updated, it means that the issuer has not yet announced the exact payment. As soon as information becomes available, we will immediately update the data. Bookmark our portal to stay updated.
Last Split Date: 01/01/1970
Splitting of shares is an increase in the number of securities of the issuing company circulating on the market due to a decrease in their value at constant capitalization.
For example, a 5: 1 ratio means that the value of one share will decrease 5 times, the total amount will increase 5 times. It is important to understand that this procedure does not change the capitalization of the company, as well as the total value of assets held in private hands.


