


April 24, 2024 Google’s Third Cookie Phaseout Delay Amid Regulatory Hurdles
April 19, 2024 Bitcoin Halving: Catalyst for New Price Heights?


Amazon: The Margin Train Is Gaining Speed

Amazon Web Services Expands Bedrock GenAI Service

Why Microsoft Stands Out As A Pre-Earnings Buy

Wall Street Lunch: Big Tech Bearishness?

April 23, 2024 Maximizing Profits: When is the Right Time to Sell Your Business?

April 12, 2024 Improve Your Financial Status: A How-To Guide
April 12, 2024 How ZIM Integrated Container Tracking is Revolutionizing Global Trade

March 15, 2024 6 Best Growth Stocks To Buy Now According to Metatrader 5

VICI Properties (VICI) Stock Forecast for 2024–2028. Vici Stock Sell or Buy?
Updated: April 25, 2024 (17:50)
Sector: Real EstateThe share price of VICI Properties Inc. (VICI) now
50/200 Day Moving Average: $29.2 / $30.04
This figure corresponds to the Average Price over the previous 50/200 days. For VICI Properties stocks, the 50-day moving average is the resistance level today.
For VICI Properties stocks, the 200-day moving average is the resistance level today.
Are you interested in VICI Properties Inc. stocks and want to buy them, or are they already in your portfolio? If yes, then on this page you will find useful information about the dynamics of the VICI Properties stock price in 2024, 2025, 2026, 2027, 2028. How much will one VICI Properties share be worth in 2024 - 2028?
When should I take profit in VICI Properties stock? When should I record a loss on VICI Properties stock? What are analysts' forecasts for VICI Properties stock? What is the future of VICI Properties stock? We forecast VICI Properties stock performance using neural networks based on historical data on VICI Properties stocks. Also, when forecasting, technical analysis tools are used, world geopolitical and news factors are taken into account.
VICI Properties stock prediction results are shown below and presented in the form of graphs, tables and text information, divided into time intervals. (Next month, 2024, 2025, 2026, 2027 and 2028) The final quotes of the instrument at the close of the previous trading day are a signal to adjust the forecasts for VICI Properties shares. This happens once a day.
Historical and forecast chart of VICI Properties stock
The chart below shows the historical price of VICI Properties stock and a prediction chart for the next month. For convenience, prices are divided by color. Forecast prices include: Optimistic Forecast, Pessimistic Forecast, and Weighted Average Best Forecast. Detailed values for the VICI Properties stock price can be found in the table below.
Long-term forecasts by years.
Don’t chalk it up to beginner’s luck if you decide to invest in VICI Properties. This specific REIT manages a massive portfolio within the gaming, entertainment, and hospitality sectors. VICI oversees over 54 gaming facilities across the U.S. and Canada, featuring big names like Caesars Palace, MGM Grand, and the Venetian. Despite being down year-to-date, it offers some real bargains.
VICI has consistently delivered robust earnings, earning an A+ Growth Grade and an ‘A’ for Profitability. Thanks to its organic growth, acquisition of MGM/Mandalay in recent years and last sales-leaseback deal in Canada, it’s been regularly increasing its dividend distribution. Primarily engaged in casino and golf transactions, VICI’s Q2 results revealed an almost 12% surge in year-over-year AFFO per share.
Some might argue that the stock’s price appears inflated given its forward P/AFFO of 13.81x versus the sector average of 13.28x. But when you consider their regular rent increases and lease-backs, it makes sense – VICI boasts an impressive average rental income of over $54M per asset. With multiple channels for revenue generation at its disposal, both VICI’s potential for growth and promising dividend performance make it a great bet!
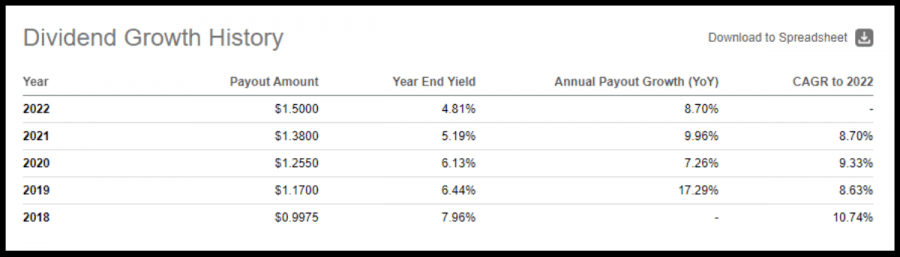
Featuring an impressive track record of dividend growth for the past four years, and with a growth rate of 17.42% and a payout ratio of 65%, VICI is a great option for offsetting some portfolio expenses. Boasting a forward dividend yield of 5.58% and a ‘B’ grade for dividend safety, its persistent dividend growth has led to an increase of 8.3% in the post-Q3 results. This reflects a compound annual growth rate of 8.2% since October 2017. In fact, in September, VICI went on ahead to boost its quarterly dividend by another 6.4%. So while it’s not suggested to put all your eggs in one basket with this stock, this Strong Buy-rated dividend stock isn’t a gamble when you consider its fundamentals.
VICI Properties daily forecast for a month
| Date | Target | Pes. | Opt. | Vol., % |
|---|---|---|---|---|
| Apr 27 | 28.69 | 28.43 | 28.82 | 1.37 |
| Apr 28 | 28.56 | 28.37 | 28.90 | 1.88 |
| Apr 29 | 28.32 | 28.04 | 28.67 | 2.23 |
| Apr 30 | 28.30 | 28.20 | 28.68 | 1.71 |
| May 01 | 28.42 | 28.08 | 28.80 | 2.58 |
| May 02 | 28.38 | 28.16 | 28.71 | 1.95 |
| May 03 | 28.19 | 27.84 | 28.30 | 1.65 |
| May 04 | 28.30 | 28.09 | 28.45 | 1.30 |
| May 05 | 28.61 | 28.46 | 28.74 | 0.99 |
| May 06 | 28.85 | 28.49 | 28.97 | 1.69 |
| May 07 | 28.60 | 28.42 | 28.82 | 1.42 |
| May 08 | 28.59 | 28.24 | 28.93 | 2.43 |
| May 09 | 29.03 | 28.70 | 29.30 | 2.10 |
| May 10 | 28.81 | 28.66 | 28.91 | 0.87 |
| May 11 | 28.90 | 28.80 | 29.02 | 0.77 |
| May 12 | 29.17 | 28.90 | 29.30 | 1.41 |
| May 13 | 29.53 | 29.25 | 29.87 | 2.13 |
| May 14 | 29.33 | 28.97 | 29.57 | 2.07 |
| May 15 | 29.38 | 29.23 | 29.68 | 1.54 |
| May 16 | 29.04 | 28.91 | 29.43 | 1.81 |
| May 17 | 29.08 | 28.75 | 29.46 | 2.46 |
| May 18 | 29.29 | 29.19 | 29.62 | 1.48 |
| May 19 | 29.31 | 29.14 | 29.69 | 1.88 |
| May 20 | 29.60 | 29.41 | 29.77 | 1.23 |
| May 21 | 30.02 | 29.72 | 30.22 | 1.68 |
| May 22 | 30.12 | 29.72 | 30.41 | 2.33 |
| May 23 | 29.85 | 29.63 | 29.96 | 1.13 |
| May 24 | 30.00 | 29.72 | 30.11 | 1.32 |
| May 25 | 29.49 | 29.16 | 29.64 | 1.65 |
| May 26 | 29.10 | 28.93 | 29.44 | 1.76 |
VICI Properties Daily Price Targets
VICI Properties Stock Forecast 04-27-2024.
Forecast target price for 04-27-2024: $28.69.
Positive dynamics for VICI Properties shares will prevail with possible volatility of 1.354%.
Pessimistic target level: 28.43
Optimistic target level: 28.82
VICI Properties Stock Forecast 04-28-2024.
Forecast target price for 04-28-2024: $28.56.
Negative dynamics for VICI Properties shares will prevail with possible volatility of 1.848%.
Pessimistic target level: 28.37
Optimistic target level: 28.90
VICI Properties Stock Forecast 04-29-2024.
Forecast target price for 04-29-2024: $28.32.
Negative dynamics for VICI Properties shares will prevail with possible volatility of 2.183%.
Pessimistic target level: 28.04
Optimistic target level: 28.67
VICI Properties Stock Forecast 04-30-2024.
Forecast target price for 04-30-2024: $28.30.
Negative dynamics for VICI Properties shares will prevail with possible volatility of 1.677%.
Pessimistic target level: 28.20
Optimistic target level: 28.68
VICI Properties Stock Forecast 05-01-2024.
Forecast target price for 05-01-2024: $28.42.
Positive dynamics for VICI Properties shares will prevail with possible volatility of 2.516%.
Pessimistic target level: 28.08
Optimistic target level: 28.80
VICI Properties Stock Forecast 05-02-2024.
Forecast target price for 05-02-2024: $28.38.
Negative dynamics for VICI Properties shares will prevail with possible volatility of 1.916%.
Pessimistic target level: 28.16
Optimistic target level: 28.71
VICI (VICI) Monthly Stock Prediction for 2024
| Month | Target | Pes. | Opt. | Vol., % |
|---|---|---|---|---|
| May. | 28.24 | 27.17 | 28.77 | 5.55 |
| Jun. | 29.91 | 29.13 | 31.34 | 7.07 |
| Jul. | 30.51 | 29.58 | 31.48 | 6.05 |
| Aug. | 29.64 | 28.15 | 30.79 | 8.57 |
| Sep. | 28.21 | 27.83 | 29.40 | 5.36 |
| Oct. | 29.00 | 28.36 | 30.45 | 6.87 |
| Nov. | 28.49 | 27.42 | 29.21 | 6.15 |
| Dec. | 27.93 | 26.66 | 29.17 | 8.59 |
VICI Properties forecast for this year
VICI Properties Stock Prediction for May 2024
An downtrend is forecast for this month with an optimal target price of $28.2355. Pessimistic: $27.17. Optimistic: $28.77
VICI Properties Stock Prediction for Jun 2024
An uptrend is forecast for this month with an optimal target price of $29.9057. Pessimistic: $29.13. Optimistic: $31.34
VICI Properties Stock Prediction for Jul 2024
An uptrend is forecast for this month with an optimal target price of $30.5082. Pessimistic: $29.58. Optimistic: $31.48
VICI Properties Stock Prediction for Aug 2024
An downtrend is forecast for this month with an optimal target price of $29.6357. Pessimistic: $28.15. Optimistic: $30.79
VICI Properties Stock Prediction for Sep 2024
An downtrend is forecast for this month with an optimal target price of $28.2102. Pessimistic: $27.83. Optimistic: $29.40
VICI Properties Stock Prediction for Oct 2024
An uptrend is forecast for this month with an optimal target price of $28.9987. Pessimistic: $28.36. Optimistic: $30.45
VICI Properties Stock Prediction for Nov 2024
An downtrend is forecast for this month with an optimal target price of $28.4898. Pessimistic: $27.42. Optimistic: $29.21
VICI Properties Stock Prediction for Dec 2024
An downtrend is forecast for this month with an optimal target price of $27.9342. Pessimistic: $26.66. Optimistic: $29.17
VICI Properties (VICI) Monthly Stock Prediction for 2025
| Month | Target | Pes. | Opt. | Vol., % |
|---|---|---|---|---|
| Jan | 27.06 | 26.27 | 27.48 | 4.42 |
| Feb | 27.80 | 26.37 | 29.21 | 9.71 |
| Mar | 26.90 | 26.41 | 27.54 | 4.13 |
| Apr | 26.92 | 26.11 | 27.32 | 4.42 |
| May | 28.33 | 27.65 | 29.71 | 6.94 |
| Jun | 29.84 | 28.78 | 30.31 | 5.06 |
| Jul | 30.39 | 29.91 | 30.82 | 2.95 |
| Aug | 30.52 | 29.10 | 31.04 | 6.26 |
| Sep | 30.98 | 29.77 | 32.11 | 7.28 |
| Oct | 31.32 | 30.53 | 31.75 | 3.85 |
| Nov | 32.95 | 31.92 | 34.00 | 6.11 |
| Dec | 31.43 | 30.55 | 32.92 | 7.20 |
VICI Properties (VICI) Monthly Stock Prediction for 2026
| Month | Target | Pes. | Opt. | Vol., % |
|---|---|---|---|---|
| Jan | 29.45 | 29.03 | 30.79 | 5.72 |
| Feb | 29.83 | 29.39 | 30.61 | 3.99 |
| Mar | 28.80 | 28.06 | 29.20 | 3.91 |
| Apr | 28.84 | 28.43 | 29.76 | 4.47 |
| May | 30.47 | 29.07 | 30.99 | 6.20 |
| Jun | 31.13 | 29.51 | 32.44 | 9.04 |
| Jul | 32.79 | 31.81 | 34.49 | 7.79 |
| Aug | 31.14 | 29.89 | 31.95 | 6.46 |
| Sep | 30.44 | 29.15 | 31.07 | 6.18 |
| Oct | 30.65 | 29.22 | 31.69 | 7.80 |
| Nov | 29.32 | 28.77 | 29.72 | 3.21 |
| Dec | 30.92 | 30.40 | 31.44 | 3.32 |
VICI Properties (VICI) Monthly Stock Prediction for 2027
| Month | Target | Pes. | Opt. | Vol., % |
|---|---|---|---|---|
| Jan | 30.36 | 29.33 | 31.88 | 7.99 |
| Feb | 31.15 | 29.95 | 32.62 | 8.19 |
| Mar | 31.47 | 30.14 | 33.04 | 8.79 |
| Apr | 32.80 | 31.37 | 34.42 | 8.86 |
| May | 31.88 | 30.43 | 32.63 | 6.73 |
| Jun | 31.43 | 29.98 | 32.43 | 7.56 |
| Jul | 31.08 | 30.33 | 31.60 | 4.03 |
| Aug | 30.29 | 29.56 | 31.65 | 6.59 |
| Sep | 30.57 | 29.69 | 31.26 | 5.02 |
| Oct | 30.49 | 29.30 | 31.78 | 7.80 |
| Nov | 30.73 | 29.89 | 31.66 | 5.61 |
| Dec | 31.11 | 29.93 | 32.22 | 7.09 |
VICI Properties (VICI) Monthly Stock Prediction for 2028
| Month | Target | Pes. | Opt. | Vol., % |
|---|---|---|---|---|
| Jan | 31.43 | 30.51 | 32.49 | 6.10 |
| Feb | 33.12 | 31.60 | 33.68 | 6.20 |
| Mar | 32.82 | 31.18 | 33.33 | 6.46 |
| Apr | 33.36 | 32.23 | 34.22 | 5.83 |
| May | 32.92 | 31.70 | 33.59 | 5.61 |
| Jun | 33.86 | 32.41 | 35.38 | 8.40 |
| Jul | 35.21 | 34.61 | 36.97 | 6.38 |
| Aug | 36.03 | 35.56 | 37.20 | 4.41 |
| Sep | 34.88 | 33.86 | 36.29 | 6.69 |
| Oct | 32.75 | 31.60 | 33.35 | 5.23 |
| Nov | 32.24 | 31.44 | 32.87 | 4.34 |
| Dec | 31.67 | 30.23 | 32.17 | 6.02 |
VICI Properties information and performance
430 PARK AVENUE, 8TH FLOOR, NEW YORK, NY, US
Market capitalization of the VICI Properties Inc. is the total market value of all issued shares of a company. It is calculated by the formula multiplying the number of VICI shares in the company outstanding by the market price of one share.
EBITDA of VICI Properties is earnings before interest, income tax and depreciation of assets.
P/E ratio (price to earnings) - shows the ratio between the price of a share and the company's profit
Price/earnings to growth
Dividend Per Share is a financial indicator equal to the ratio of the company's net profit available for distribution to the annual average of ordinary shares.
Dividend yield is a ratio that shows how much a company pays in dividends each year at the stock price.
EPS shows how much of the net profit is accounted for by the common share.
Trailing P/E depends on what has already been done. It uses the current share price and divides it by the total earnings per share for the last 12 months.
Forward P/E uses projections of future earnings instead of final numbers.
Enterprise Value (EV) /Revenue
The EV / EBITDA ratio shows the ratio of the cost (EV) to its profit before tax, interest and amortization (EBITDA).
Number of issued ordinary shares
Number of freely tradable shares
Shares Short Prior Month - the number of shares in short positions in the last month.
VICI Properties (VICI) stock dividend
VICI Properties last paid dividends on 03/20/2024. The next scheduled payment will be on 04/04/2024. The amount of dividends is $1.61 per share. If the date of the next dividend payment has not been updated, it means that the issuer has not yet announced the exact payment. As soon as information becomes available, we will immediately update the data. Bookmark our portal to stay updated.
Last Split Date: 01/01/1970
Splitting of shares is an increase in the number of securities of the issuing company circulating on the market due to a decrease in their value at constant capitalization.
For example, a 5: 1 ratio means that the value of one share will decrease 5 times, the total amount will increase 5 times. It is important to understand that this procedure does not change the capitalization of the company, as well as the total value of assets held in private hands.
Related stocks from Real Estate sector


