


April 19, 2024 Bitcoin Halving: Catalyst for New Price Heights?
April 18, 2024 EU Moves Toward Single Capital Market Union
April 17, 2024 Bitcoin Halving 2024: Market Impact Predictions
April 14, 2024 Markets Rattle: Iran-Israel Conflict and Economic Data Ahead


Apple’s Technical Climb To $240 By Year-End

April 12, 2024 Improve Your Financial Status: A How-To Guide
April 12, 2024 How ZIM Integrated Container Tracking is Revolutionizing Global Trade

March 15, 2024 6 Best Growth Stocks To Buy Now According to Metatrader 5

March 6, 2024 Navigating GBP Forecast: Mistakes To Avoid In Forex Trading

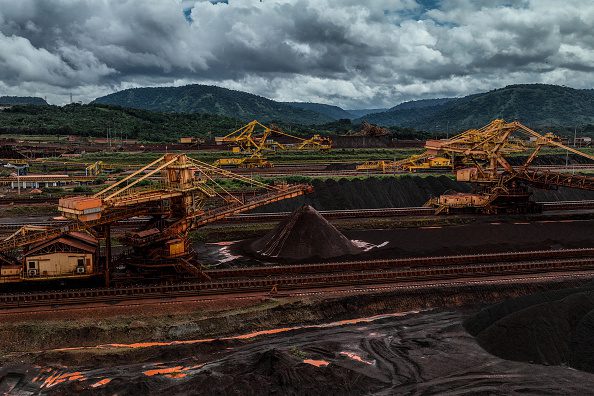
Vale S.A. (VALE) Stock Forecast for 2025. Vale Shares Prediction
Updated: April 17, 2024 (17:10)
Sector: Basic materialsThe share price of Vale S.A. (VALE) now
50/200 Day Moving Average: $12.78 / $13.72
This figure corresponds to the Average Price over the previous 50/200 days. For Vale S.A. stocks, the 50-day moving average is the resistance level today.
For Vale S.A. stocks, the 200-day moving average is the resistance level today.
Are you interested in Vale S.A. stocks and want to buy them, or are they already in your portfolio? If yes, then on this page you will find useful information about the dynamics of the Vale S.A. stock price in 2025. How much will one Vale S.A. share be worth in 2025? Is it worth taking profit / loss on VALE stock now or waiting? What are analysts' forecasts for Vale S.A. stock?
We forecast Vale S.A. stock performance using neural networks based on historical data on VALE stocks. Also, when forecasting, technical analysis tools are used, world geopolitical and news factors are taken into account. This corporation stock prediction results are shown below and presented as a graph, table and text information.
Vale S.A. stock forecasts are adjusted once a day based on the closing price of the previous trading day.
The minimum target price for Vale S.A. analysts is $16.6. Today 200 Day Moving Average is the resistance level (13.72 $). 50 Day Moving Average is the resistance level (12.78 $).
Historical and forecast chart of Vale S.A. stock
The chart below shows the historical price of Vale S.A. stock and a prediction chart for the next year. For convenience, prices are divided by color. Forecast prices include: Optimistic Forecast, Pessimistic Forecast, and Weighted Average Best Forecast. Detailed values for the VALE stock price can be found in the table below.
Sell or Buy Vale S.A. (VALE) stocks? Analytic Experts Forecasting...


Vale: Why I’m Buying More Despite The Noise

Vale: Potential Value Trap Reliant On Weakening Chinese Iron Ore Demand
The Uncertain Future of VALE Stocks in 2025: Risk Factors and Predictions
Forecasting the VALE S.A. stock rates, especially for the year 2025, envelops a spectrum of uncertainties due to the inherent volatility of the commodities market and external economic influences. Given VALE’s nature as a leading iron ore producer and the fluctuating demands of the market, predicting the exact trajectory of VALE stocks is fraught with complexity.
Key Influences on VALE Stock Rates in 2025
Several pivotal events and factors stand poised to significantly impact the rate of VALE stocks in 2025. Notably, the Chinese property market and iron ore prices will be critical determinants. A previous bear call on VALE highlighted concerns over China’s construction sector, which directly influences steel demand and, by extension, iron ore prices. With construction accounting for over 50% of Chinese steel demand, the downturn in new home sales and housing starts from their 2021 peak poses a significant risk. The management’s estimated breakeven production costs for VALE for 2023 are $52-54/ton, but this slowdown may significantly reduce iron ore demand, potentially driving prices to those levels. Such a scenario could materially diminish VALE’s profitability and affect its stock performance.
Furthermore, the Australian government’s estimate that iron ore prices may settle at $63/ton by 2028, assuming flat steel production and iron ore demand in China, adds to the uncertainty. This projection, coupled with the precarious situation of China’s property market and its implications for steel demand, underscores the difficulty in accurately forecasting VALE stocks.
In essence, while predicting the exact rates of VALE stocks in 2025 is a challenge, observing the trends in the Chinese property market, steel demand, and iron ore prices will provide vital clues. Investors eyeing VALE stock should remain vigilant, considering the possible volatility and risks associated with these factors.
Vale S.A. (VALE) Forecast for 2025
| Month | Target | Pes. | Opt. | Vol., % |
|---|---|---|---|---|
| Jan | 15.97 | 15.05 | 16.46 | 8.61 % |
| Feb | 15.76 | 14.70 | 16.23 | 9.44 % |
| Mar | 16.02 | 15.17 | 17.46 | 13.10 % |
| Apr | 15.37 | 13.91 | 16.58 | 16.12 % |
| May | 17.01 | 16.52 | 17.82 | 7.33 % |
| Jun | 16.72 | 16.32 | 17.38 | 6.12 % |
| Jul | 17.93 | 17.47 | 18.40 | 5.03 % |
| Aug | 19.15 | 18.05 | 20.42 | 11.59 % |
| Sep | 20.16 | 18.28 | 21.69 | 15.73 % |
| Oct | 22.46 | 20.74 | 23.65 | 12.31 % |
| Nov | 23.78 | 22.64 | 25.12 | 9.88 % |
| Dec | 22.19 | 20.59 | 22.77 | 9.59 % |
Vale S.A. information and performance
AVENIDA GRACA ARANHA #26, RIO DE JANEIRO, BR
Market capitalization of the Vale S.A. is the total market value of all issued shares of a company. It is calculated by the formula multiplying the number of VALE shares in the company outstanding by the market price of one share.
EBITDA of Vale S.A. is earnings before interest, income tax and depreciation of assets.
P/E ratio (price to earnings) - shows the ratio between the price of a share and the company's profit
Price/earnings to growth
Dividend Per Share is a financial indicator equal to the ratio of the company's net profit available for distribution to the annual average of ordinary shares.
Dividend yield is a ratio that shows how much a company pays in dividends each year at the stock price.
EPS shows how much of the net profit is accounted for by the common share.
Trailing P/E depends on what has already been done. It uses the current share price and divides it by the total earnings per share for the last 12 months.
Forward P/E uses projections of future earnings instead of final numbers.
Enterprise Value (EV) /Revenue
The EV / EBITDA ratio shows the ratio of the cost (EV) to its profit before tax, interest and amortization (EBITDA).
Number of issued ordinary shares
Number of freely tradable shares
Shares Short Prior Month - the number of shares in short positions in the last month.
Vale S.A. price target for 2025 by month
Target values for the price of one Vale S.A. share for Jan 2025.
In Jan, the Positive dynamics for Vale S.A. shares will prevail with possible monthly volatility of 8.611% volatility is expected.
Pessimistic target level: 15.05
Optimistic target level: 16.46
Target values for the price of one Vale S.A. share for Feb 2025.
In Feb, the Negative dynamics for Vale S.A. shares will prevail with possible monthly volatility of 9.437% volatility is expected.
Pessimistic target level: 14.70
Optimistic target level: 16.23
Target values for the price of one Vale S.A. share for Mar 2025.
In Mar, the Positive dynamics for Vale S.A. shares will prevail with possible monthly volatility of 13.101% volatility is expected.
Pessimistic target level: 15.17
Optimistic target level: 17.46
Target values for the price of one Vale S.A. share for Apr 2025.
In Apr, the Negative dynamics for Vale S.A. shares will prevail with possible monthly volatility of 16.123% volatility is expected.
Pessimistic target level: 13.91
Optimistic target level: 16.58
Target values for the price of one Vale S.A. share for May 2025.
In May, the Positive dynamics for Vale S.A. shares will prevail with possible monthly volatility of 7.328% volatility is expected.
Pessimistic target level: 16.52
Optimistic target level: 17.82
Target values for the price of one Vale S.A. share for Jun 2025.
In Jun, the Negative dynamics for Vale S.A. shares will prevail with possible monthly volatility of 6.117% volatility is expected.
Pessimistic target level: 16.32
Optimistic target level: 17.38
Target values for the price of one Vale S.A. share for Jul 2025.
In Jul, the Positive dynamics for Vale S.A. shares will prevail with possible monthly volatility of 5.027% volatility is expected.
Pessimistic target level: 17.47
Optimistic target level: 18.40
Target values for the price of one Vale S.A. share for Aug 2025.
In Aug, the Positive dynamics for Vale S.A. shares will prevail with possible monthly volatility of 11.594% volatility is expected.
Pessimistic target level: 18.05
Optimistic target level: 20.42
Target values for the price of one Vale S.A. share for Sep 2025.
In Sep, the Positive dynamics for Vale S.A. shares will prevail with possible monthly volatility of 15.731% volatility is expected.
Pessimistic target level: 18.28
Optimistic target level: 21.69
Target values for the price of one Vale S.A. share for Oct 2025.
In Oct, the Positive dynamics for Vale S.A. shares will prevail with possible monthly volatility of 12.310% volatility is expected.
Pessimistic target level: 20.74
Optimistic target level: 23.65
Target values for the price of one Vale S.A. share for Nov 2025.
In Nov, the Positive dynamics for Vale S.A. shares will prevail with possible monthly volatility of 9.883% volatility is expected.
Pessimistic target level: 22.64
Optimistic target level: 25.12
Target values for the price of one Vale S.A. share for Dec 2025.
In Dec, the Negative dynamics for Vale S.A. shares will prevail with possible monthly volatility of 9.587% volatility is expected.
Pessimistic target level: 20.59
Optimistic target level: 22.77
Vale S.A. (VALE) stock dividend
Vale S.A. last paid dividends on 03/12/2024. The next scheduled payment will be on 03/26/2024. The amount of dividends is $1.75 per share. If the date of the next dividend payment has not been updated, it means that the issuer has not yet announced the exact payment. As soon as information becomes available, we will immediately update the data. Bookmark our portal to stay updated.
Last Split Date: 01/01/1970
Splitting of shares is an increase in the number of securities of the issuing company circulating on the market due to a decrease in their value at constant capitalization.
For example, a 5: 1 ratio means that the value of one share will decrease 5 times, the total amount will increase 5 times. It is important to understand that this procedure does not change the capitalization of the company, as well as the total value of assets held in private hands.


