


April 19, 2024 Bitcoin Halving: Catalyst for New Price Heights?
April 18, 2024 EU Moves Toward Single Capital Market Union
April 17, 2024 Bitcoin Halving 2024: Market Impact Predictions
April 14, 2024 Markets Rattle: Iran-Israel Conflict and Economic Data Ahead


Apple’s Technical Climb To $240 By Year-End

April 12, 2024 Improve Your Financial Status: A How-To Guide
April 12, 2024 How ZIM Integrated Container Tracking is Revolutionizing Global Trade

March 15, 2024 6 Best Growth Stocks To Buy Now According to Metatrader 5

March 6, 2024 Navigating GBP Forecast: Mistakes To Avoid In Forex Trading

Toyota Motor (TM) Stock Forecast for 2024–2028. Sell or Buy?
Updated: April 20, 2024 (01:20)
Sector: Counsumer cyclicalThe share price of Toyota Motor Corp. (TM) now
50/200 Day Moving Average: $236.92 / $193.27
This figure corresponds to the Average Price over the previous 50/200 days. For Toyota Motor stocks, the 50-day moving average is the resistance level today.
For Toyota Motor stocks, the 200-day moving average is the support level today.
Are you interested in Toyota Motor Corp. stocks and want to buy them, or are they already in your portfolio? If yes, then on this page you will find useful information about the dynamics of the Toyota Motor stock price in 2024, 2025, 2026, 2027, 2028. How much will one Toyota Motor share be worth in 2024 - 2028?
When should I take profit in Toyota Motor stock? When should I record a loss on Toyota Motor stock? What are analysts' forecasts for Toyota Motor stock? What is the future of Toyota Motor stock? We forecast Toyota Motor stock performance using neural networks based on historical data on Toyota Motor stocks. Also, when forecasting, technical analysis tools are used, world geopolitical and news factors are taken into account.
Toyota Motor stock prediction results are shown below and presented in the form of graphs, tables and text information, divided into time intervals. (Next month, 2024, 2025, 2026, 2027 and 2028) The final quotes of the instrument at the close of the previous trading day are a signal to adjust the forecasts for Toyota Motor shares. This happens once a day.
Historical and forecast chart of Toyota Motor stock
The chart below shows the historical price of Toyota Motor stock and a prediction chart for the next month. For convenience, prices are divided by color. Forecast prices include: Optimistic Forecast, Pessimistic Forecast, and Weighted Average Best Forecast. Detailed values for the Toyota Motor stock price can be found in the table below.
Long-term forecasts by years.
After a disappointing third quarter report, Tesla’s stocks took a 9% dive, primarily due to shrinking profit margins and struggles with the Cybertruck line.
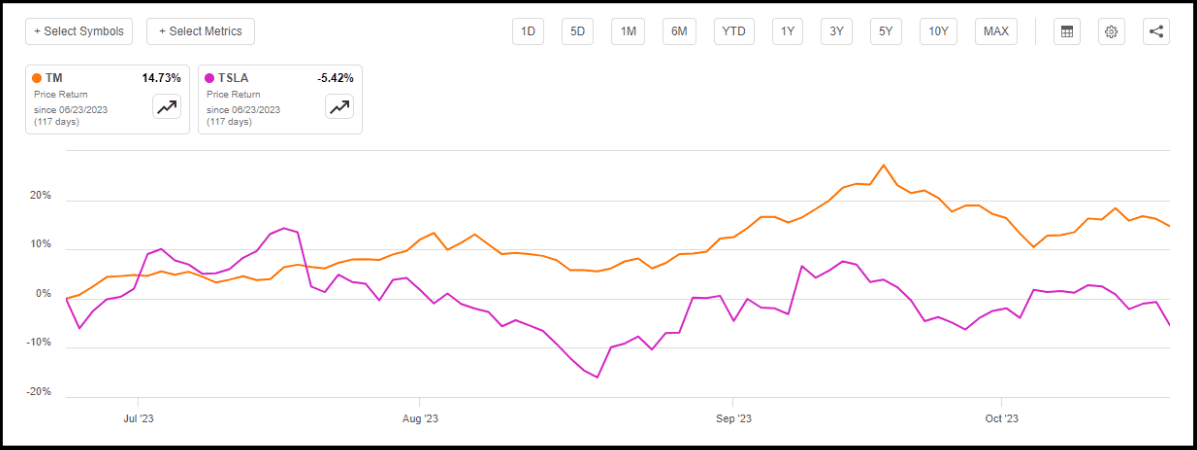
Meanwhile, since my article ‘Toyota Trumps Tesla’ published on June 23, 2023, Toyota’s stocks have experienced a 14% growth compared to a 5% decrease in Tesla’s over the same span.
Toyota has been throwing down the gauntlet to Tesla in various areas. With its recent revolutionary battery deal expected to challenge Tesla’s electric vehicle plans, Toyota is fortifying its position at the apex of car manufacturing.
Evidently, Toyota’s substantial business integrity makes it a standout among auto manufacturing stocks, comfortably surpassing its primary EV rival. The company is buoyed by surging demand and a robust global network.
According to Bill Ford – Executive Chairman of Ford, the ongoing strike by United Automobile Workers (UAW) should provide significant benefits to both Tesla and Toyota. Although the strike was causing production issues for other car producers like Ford and General Motors, companies like Toyota and Tesla were likely profiting from it. Despite being perfectly situated to capture market share, Tesla’s stock suffered another hard hit following dismal third-quarter earnings results.
With a legacy in vehicle and related parts manufacturing dating back to 1933, Toyota so far has seen a year-to-date (YTD) increase of 32. 57% compared to Tesla’s modest YTD rise of just 10.21%.
This narrative speaks volumes about how Toyota’s sterling reputation and top-notch manufacturing process have significantly boosted its profits, allowing it to consistently deliver impressive results at both ends of the financials.
Toyota Motor daily forecast for a month
| Date | Target | Pes. | Opt. | Vol., % |
|---|---|---|---|---|
| Apr 21 | 233.12 | 232.39 | 235.39 | 1.29 |
| Apr 22 | 233.15 | 231.69 | 234.20 | 1.09 |
| Apr 23 | 233.82 | 232.91 | 234.56 | 0.71 |
| Apr 24 | 235.33 | 234.06 | 236.77 | 1.16 |
| Apr 25 | 238.47 | 237.18 | 241.22 | 1.70 |
| Apr 26 | 237.43 | 235.29 | 240.28 | 2.12 |
| Apr 27 | 238.32 | 236.03 | 240.93 | 2.07 |
| Apr 28 | 237.00 | 236.29 | 238.85 | 1.08 |
| Apr 29 | 237.53 | 236.43 | 239.56 | 1.33 |
| Apr 30 | 235.32 | 234.05 | 237.09 | 1.30 |
| May 01 | 237.09 | 234.28 | 239.68 | 2.31 |
| May 02 | 239.01 | 236.21 | 241.52 | 2.25 |
| May 03 | 240.87 | 238.56 | 243.26 | 1.97 |
| May 04 | 242.35 | 240.54 | 243.55 | 1.25 |
| May 05 | 243.63 | 242.86 | 245.49 | 1.08 |
| May 06 | 243.99 | 241.39 | 246.55 | 2.14 |
| May 07 | 243.63 | 242.86 | 245.75 | 1.19 |
| May 08 | 242.27 | 240.68 | 244.75 | 1.69 |
| May 09 | 241.15 | 240.24 | 243.10 | 1.19 |
| May 10 | 238.00 | 237.29 | 239.18 | 0.80 |
| May 11 | 239.04 | 237.71 | 241.65 | 1.66 |
| May 12 | 240.08 | 238.71 | 242.27 | 1.49 |
| May 13 | 241.01 | 238.45 | 243.15 | 1.97 |
| May 14 | 239.53 | 237.81 | 241.90 | 1.72 |
| May 15 | 241.54 | 239.04 | 242.41 | 1.41 |
| May 16 | 242.77 | 240.30 | 245.25 | 2.06 |
| May 17 | 241.28 | 239.36 | 242.51 | 1.32 |
| May 18 | 242.69 | 240.47 | 245.39 | 2.04 |
| May 19 | 241.75 | 241.02 | 242.98 | 0.81 |
| May 20 | 239.57 | 237.13 | 241.55 | 1.86 |
Toyota Motor Daily Price Targets
Toyota Motor Stock Forecast 04-21-2024.
Forecast target price for 04-21-2024: $233.12.
Positive dynamics for Toyota Motor shares will prevail with possible volatility of 1.277%.
Pessimistic target level: 232.39
Optimistic target level: 235.39
Toyota Motor Stock Forecast 04-22-2024.
Forecast target price for 04-22-2024: $233.15.
Positive dynamics for Toyota Motor shares will prevail with possible volatility of 1.076%.
Pessimistic target level: 231.69
Optimistic target level: 234.20
Toyota Motor Stock Forecast 04-23-2024.
Forecast target price for 04-23-2024: $233.82.
Positive dynamics for Toyota Motor shares will prevail with possible volatility of 0.703%.
Pessimistic target level: 232.91
Optimistic target level: 234.56
Toyota Motor Stock Forecast 04-24-2024.
Forecast target price for 04-24-2024: $235.33.
Positive dynamics for Toyota Motor shares will prevail with possible volatility of 1.148%.
Pessimistic target level: 234.06
Optimistic target level: 236.77
Toyota Motor Stock Forecast 04-25-2024.
Forecast target price for 04-25-2024: $238.47.
Positive dynamics for Toyota Motor shares will prevail with possible volatility of 1.676%.
Pessimistic target level: 237.18
Optimistic target level: 241.22
Toyota Motor Stock Forecast 04-26-2024.
Forecast target price for 04-26-2024: $237.43.
Negative dynamics for Toyota Motor shares will prevail with possible volatility of 2.075%.
Pessimistic target level: 235.29
Optimistic target level: 240.28
TM (TM) Monthly Stock Prediction for 2024
| Month | Target | Pes. | Opt. | Vol., % |
|---|---|---|---|---|
| May. | 245.11 | 242.17 | 250.70 | 3.40 |
| Jun. | 254.96 | 249.15 | 260.31 | 4.29 |
| Jul. | 250.37 | 244.51 | 257.73 | 5.13 |
| Aug. | 236.85 | 227.19 | 245.95 | 7.63 |
| Sep. | 241.40 | 235.03 | 248.79 | 5.53 |
| Oct. | 243.43 | 233.06 | 247.66 | 5.90 |
| Nov. | 251.02 | 244.70 | 262.47 | 6.77 |
| Dec. | 255.39 | 245.12 | 263.97 | 7.14 |
Toyota Motor forecast for this year
Toyota Motor Stock Prediction for May 2024
An uptrend is forecast for this month with an optimal target price of $245.106. Pessimistic: $242.17. Optimistic: $250.70
Toyota Motor Stock Prediction for Jun 2024
An uptrend is forecast for this month with an optimal target price of $254.96. Pessimistic: $249.15. Optimistic: $260.31
Toyota Motor Stock Prediction for Jul 2024
An downtrend is forecast for this month with an optimal target price of $250.37. Pessimistic: $244.51. Optimistic: $257.73
Toyota Motor Stock Prediction for Aug 2024
An downtrend is forecast for this month with an optimal target price of $236.85. Pessimistic: $227.19. Optimistic: $245.95
Toyota Motor Stock Prediction for Sep 2024
An uptrend is forecast for this month with an optimal target price of $241.398. Pessimistic: $235.03. Optimistic: $248.79
Toyota Motor Stock Prediction for Oct 2024
An uptrend is forecast for this month with an optimal target price of $243.426. Pessimistic: $233.06. Optimistic: $247.66
Toyota Motor Stock Prediction for Nov 2024
An uptrend is forecast for this month with an optimal target price of $251.02. Pessimistic: $244.70. Optimistic: $262.47
Toyota Motor Stock Prediction for Dec 2024
An uptrend is forecast for this month with an optimal target price of $255.388. Pessimistic: $245.12. Optimistic: $263.97
Toyota Motor (TM) Monthly Stock Prediction for 2025
| Month | Target | Pes. | Opt. | Vol., % |
|---|---|---|---|---|
| Jan | 251.71 | 242.05 | 262.13 | 7.66 |
| Feb | 259.72 | 252.70 | 269.84 | 6.35 |
| Mar | 265.48 | 257.36 | 274.40 | 6.21 |
| Apr | 256.08 | 245.94 | 261.92 | 6.10 |
| May | 248.86 | 244.98 | 258.72 | 5.31 |
| Jun | 241.99 | 239.09 | 246.20 | 2.89 |
| Jul | 245.62 | 235.16 | 249.01 | 5.56 |
| Aug | 259.77 | 254.78 | 268.50 | 5.11 |
| Sep | 261.64 | 254.89 | 270.75 | 5.86 |
| Oct | 268.08 | 262.29 | 280.62 | 6.53 |
| Nov | 268.08 | 260.52 | 279.02 | 6.63 |
| Dec | 272.58 | 265.06 | 285.01 | 7.00 |
Toyota Motor (TM) Monthly Stock Prediction for 2026
| Month | Target | Pes. | Opt. | Vol., % |
|---|---|---|---|---|
| Jan | 277.49 | 272.83 | 282.82 | 3.53 |
| Feb | 284.98 | 275.75 | 295.58 | 6.71 |
| Mar | 274.21 | 270.26 | 277.50 | 2.61 |
| Apr | 266.80 | 259.60 | 277.21 | 6.35 |
| May | 260.40 | 248.53 | 266.49 | 6.74 |
| Jun | 257.74 | 246.30 | 265.94 | 7.39 |
| Jul | 253.11 | 245.21 | 258.27 | 5.06 |
| Aug | 252.35 | 247.80 | 258.10 | 3.99 |
| Sep | 258.55 | 248.63 | 265.69 | 6.42 |
| Oct | 251.11 | 243.12 | 258.04 | 5.78 |
| Nov | 252.61 | 245.49 | 263.22 | 6.74 |
| Dec | 263.98 | 255.59 | 271.11 | 5.73 |
Toyota Motor (TM) Monthly Stock Prediction for 2027
| Month | Target | Pes. | Opt. | Vol., % |
|---|---|---|---|---|
| Jan | 261.61 | 252.34 | 274.01 | 7.91 |
| Feb | 271.97 | 262.34 | 275.56 | 4.80 |
| Mar | 276.53 | 272.39 | 280.02 | 2.73 |
| Apr | 271.22 | 260.65 | 275.94 | 5.54 |
| May | 268.95 | 259.43 | 272.50 | 4.80 |
| Jun | 284.92 | 273.81 | 296.89 | 7.77 |
| Jul | 283.04 | 278.46 | 287.29 | 3.07 |
| Aug | 266.40 | 257.61 | 274.55 | 6.17 |
| Sep | 256.97 | 249.10 | 261.59 | 4.77 |
| Oct | 255.73 | 244.07 | 266.78 | 8.51 |
| Nov | 261.11 | 256.72 | 269.88 | 4.88 |
| Dec | 254.68 | 249.18 | 262.93 | 5.23 |
Toyota Motor (TM) Monthly Stock Prediction for 2028
| Month | Target | Pes. | Opt. | Vol., % |
|---|---|---|---|---|
| Jan | 253.92 | 247.52 | 258.79 | 4.36 |
| Feb | 248.59 | 238.59 | 258.43 | 7.68 |
| Mar | 242.17 | 236.65 | 252.78 | 6.38 |
| Apr | 241.30 | 230.15 | 248.39 | 7.34 |
| May | 245.21 | 237.26 | 251.68 | 5.73 |
| Jun | 247.12 | 240.75 | 251.57 | 4.30 |
| Jul | 255.43 | 247.00 | 264.77 | 6.71 |
| Aug | 245.92 | 242.68 | 251.53 | 3.52 |
| Sep | 253.01 | 248.30 | 263.94 | 5.92 |
| Oct | 258.93 | 255.04 | 271.20 | 5.96 |
| Nov | 251.00 | 244.53 | 256.12 | 4.53 |
| Dec | 257.03 | 249.93 | 263.81 | 5.26 |
Toyota Motor information and performance
1 TOYOTA CHO TOYOTA CITY, AICHI PREFECTURE 471-8571, JAPAN, JP
Market capitalization of the Toyota Motor Corp. is the total market value of all issued shares of a company. It is calculated by the formula multiplying the number of TM shares in the company outstanding by the market price of one share.
EBITDA of Toyota Motor is earnings before interest, income tax and depreciation of assets.
P/E ratio (price to earnings) - shows the ratio between the price of a share and the company's profit
Price/earnings to growth
Dividend Per Share is a financial indicator equal to the ratio of the company's net profit available for distribution to the annual average of ordinary shares.
Dividend yield is a ratio that shows how much a company pays in dividends each year at the stock price.
EPS shows how much of the net profit is accounted for by the common share.
Trailing P/E depends on what has already been done. It uses the current share price and divides it by the total earnings per share for the last 12 months.
Forward P/E uses projections of future earnings instead of final numbers.
Enterprise Value (EV) /Revenue
The EV / EBITDA ratio shows the ratio of the cost (EV) to its profit before tax, interest and amortization (EBITDA).
Number of issued ordinary shares
Number of freely tradable shares
Shares Short Prior Month - the number of shares in short positions in the last month.
Toyota Motor (TM) stock dividend
Toyota Motor last paid dividends on 09/28/2023. The next scheduled payment will be on 12/04/2023. The amount of dividends is $65 per share. If the date of the next dividend payment has not been updated, it means that the issuer has not yet announced the exact payment. As soon as information becomes available, we will immediately update the data. Bookmark our portal to stay updated.
Last Split Date: 01/01/1970
Splitting of shares is an increase in the number of securities of the issuing company circulating on the market due to a decrease in their value at constant capitalization.
For example, a 5: 1 ratio means that the value of one share will decrease 5 times, the total amount will increase 5 times. It is important to understand that this procedure does not change the capitalization of the company, as well as the total value of assets held in private hands.