


April 19, 2024 Bitcoin Halving: Catalyst for New Price Heights?
April 18, 2024 EU Moves Toward Single Capital Market Union
April 17, 2024 Bitcoin Halving 2024: Market Impact Predictions
April 14, 2024 Markets Rattle: Iran-Israel Conflict and Economic Data Ahead


Apple’s Technical Climb To $240 By Year-End

April 12, 2024 Improve Your Financial Status: A How-To Guide
April 12, 2024 How ZIM Integrated Container Tracking is Revolutionizing Global Trade

March 15, 2024 6 Best Growth Stocks To Buy Now According to Metatrader 5

March 6, 2024 Navigating GBP Forecast: Mistakes To Avoid In Forex Trading

Pfizer (PFE) stock forecast for 2025
Updated: April 17, 2024 (09:40)
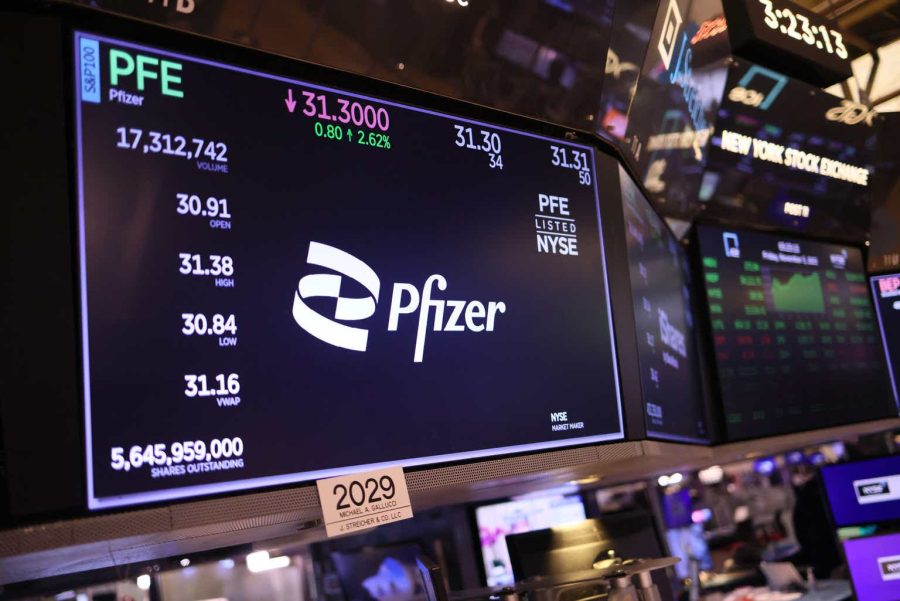
Sector: HealthcareThe share price of Pfizer Inc. (PFE) now
50/200 Day Moving Average: $27.23 / $30.96
This figure corresponds to the Average Price over the previous 50/200 days. For Pfizer stocks, the 50-day moving average is the resistance level today.
For Pfizer stocks, the 200-day moving average is the resistance level today.
Are you interested in Pfizer Inc. stocks and want to buy them, or are they already in your portfolio? If yes, then on this page you will find useful information about the dynamics of the Pfizer stock price in 2025. How much will one Pfizer share be worth in 2025? Is it worth taking profit / loss on PFE stock now or waiting? What are analysts' forecasts for Pfizer stock?
We forecast Pfizer stock performance using neural networks based on historical data on PFE stocks. Also, when forecasting, technical analysis tools are used, world geopolitical and news factors are taken into account. This corporation stock prediction results are shown below and presented as a graph, table and text information.
Pfizer Inc. stock forecasts are adjusted once a day based on the closing price of the previous trading day.
The minimum target price for Pfizer analysts is $31.1. Today 200 Day Moving Average is the resistance level (30.96 $). 50 Day Moving Average is the support level (27.23 $).
Historical and forecast chart of Pfizer Inc. stock
The chart below shows the historical price of Pfizer stock and a prediction chart for the next year. For convenience, prices are divided by color. Forecast prices include: Optimistic Forecast, Pessimistic Forecast, and Weighted Average Best Forecast. Detailed values for the PFE stock price can be found in the table below.
Sell or Buy Pfizer (PFE) stocks? Analytic Experts Forecasting...


Pfizer: Seagen Acquisition Starting To Bear Fruit
Unlocking the Future: Pfizer’s 2025 Stock Forecast and the Road Ahead
Predicting the precise journey of stock prices remains a sophisticated endeavor, shrouded in the unpredictability of market dynamics and global events. Nevertheless, insightful analysis of underlying company fundamentals, strategic moves, and broader industry trends can provide a compelling forecast. As we look towards 2025, Pfizer Inc. (NYSE:PFE), a venerable giant in the pharmaceutical industry, presents a fascinating case study in resilience, innovation, and potential growth.
The Foundation of Pfizer’s 2025 Forecast
A key lever in forecasting the PFE stock price for 2025 hinges on the company’s strong product pipeline and robust financial health. Despite experiencing a downturn in sales from its crown jewels – the COVID-19 vaccine, Comirnaty, and the antiviral, Paxlovid, Pfizer’s underlying performance tells a story of resilience and growth. Operating sales excluding these products grew by 7% in 2023, hinting at a company not solely reliant on pandemic-era blockbusters. This growth trajectory, alongside strategic acquisitions such as Seagen – a leader in antibody-drug conjugates (ADC) – underscores Pfizer’s commitment to staying at the innovation forefront.
Projected EPS growth and an anticipated rise in EBITDA margins further bolster confidence in PFE stock. The calculations suggest a promising growth potential of 20.8% by the end of 2024, skyrocketing to an impressive 50.2% by the culmination of 2025. Such growth is not only ambitious but grounded in a series of conservative estimates reflecting management’s strategic acumen and the diversified nature of Pfizer’s portfolio.
Factors influencing this optimistic PFE stock forecast for 2025 include the expansion and successful commercialization of its pipeline products, the effective navigation of patent cliffs, and continued strategic acquisitions. Moreover, Pfizer’s ability to rebound and grow beyond its COVID-related products signals a resilient and adaptable giant ready to face future challenges.
In conclusion, while no forecast can claim absolute certainty, the synthesis of Pfizer’s strategic positioning, financial health, and innovation pipeline provides a compelling case for a positive PFE stock price forecast towards 2025. Investors keen on the healthcare sector would do well to consider Pfizer not just for its past achievements but for its forward-looking promise, making it a potentially lucrative addition to long-term portfolios.
Pfizer (PFE) Forecast for 2025
| Month | Target | Pes. | Opt. | Vol., % |
|---|---|---|---|---|
| Jan | 22.90 | 22.38 | 24.40 | 8.28 % |
| Feb | 21.15 | 20.20 | 21.81 | 7.42 % |
| Mar | 21.70 | 21.23 | 22.46 | 5.48 % |
| Apr | 22.64 | 21.70 | 23.27 | 6.74 % |
| May | 24.47 | 23.39 | 25.95 | 9.85 % |
| Jun | 23.77 | 22.50 | 24.54 | 8.28 % |
| Jul | 25.61 | 24.80 | 26.53 | 6.52 % |
| Aug | 27.56 | 26.35 | 28.61 | 7.89 % |
| Sep | 26.37 | 25.16 | 28.13 | 10.55 % |
| Oct | 25.97 | 24.94 | 27.49 | 9.27 % |
| Nov | 27.14 | 26.50 | 28.90 | 8.28 % |
| Dec | 26.14 | 25.53 | 27.22 | 6.22 % |
Pfizer information and performance
235 E 42ND ST, NEW YORK, NY, US
Market capitalization of the Pfizer Inc. is the total market value of all issued shares of a company. It is calculated by the formula multiplying the number of PFE shares in the company outstanding by the market price of one share.
EBITDA of Pfizer is earnings before interest, income tax and depreciation of assets.
P/E ratio (price to earnings) - shows the ratio between the price of a share and the company's profit
Price/earnings to growth
Dividend Per Share is a financial indicator equal to the ratio of the company's net profit available for distribution to the annual average of ordinary shares.
Dividend yield is a ratio that shows how much a company pays in dividends each year at the stock price.
EPS shows how much of the net profit is accounted for by the common share.
Trailing P/E depends on what has already been done. It uses the current share price and divides it by the total earnings per share for the last 12 months.
Forward P/E uses projections of future earnings instead of final numbers.
Enterprise Value (EV) /Revenue
The EV / EBITDA ratio shows the ratio of the cost (EV) to its profit before tax, interest and amortization (EBITDA).
Number of issued ordinary shares
Number of freely tradable shares
Shares Short Prior Month - the number of shares in short positions in the last month.
Pfizer price target for 2025 by month
Target values for the price of one Pfizer share for Jan 2025.
In Jan, the Positive dynamics for Pfizer Inc. shares will prevail with possible monthly volatility of 8.276% volatility is expected.
Pessimistic target level: 22.38
Optimistic target level: 24.40
Target values for the price of one Pfizer share for Feb 2025.
In Feb, the Negative dynamics for Pfizer Inc. shares will prevail with possible monthly volatility of 7.416% volatility is expected.
Pessimistic target level: 20.20
Optimistic target level: 21.81
Target values for the price of one Pfizer share for Mar 2025.
In Mar, the Positive dynamics for Pfizer Inc. shares will prevail with possible monthly volatility of 5.478% volatility is expected.
Pessimistic target level: 21.23
Optimistic target level: 22.46
Target values for the price of one Pfizer share for Apr 2025.
In Apr, the Positive dynamics for Pfizer Inc. shares will prevail with possible monthly volatility of 6.742% volatility is expected.
Pessimistic target level: 21.70
Optimistic target level: 23.27
Target values for the price of one Pfizer share for May 2025.
In May, the Positive dynamics for Pfizer Inc. shares will prevail with possible monthly volatility of 9.846% volatility is expected.
Pessimistic target level: 23.39
Optimistic target level: 25.95
Target values for the price of one Pfizer share for Jun 2025.
In Jun, the Negative dynamics for Pfizer Inc. shares will prevail with possible monthly volatility of 8.282% volatility is expected.
Pessimistic target level: 22.50
Optimistic target level: 24.54
Target values for the price of one Pfizer share for Jul 2025.
In Jul, the Positive dynamics for Pfizer Inc. shares will prevail with possible monthly volatility of 6.516% volatility is expected.
Pessimistic target level: 24.80
Optimistic target level: 26.53
Target values for the price of one Pfizer share for Aug 2025.
In Aug, the Positive dynamics for Pfizer Inc. shares will prevail with possible monthly volatility of 7.892% volatility is expected.
Pessimistic target level: 26.35
Optimistic target level: 28.61
Target values for the price of one Pfizer share for Sep 2025.
In Sep, the Negative dynamics for Pfizer Inc. shares will prevail with possible monthly volatility of 10.547% volatility is expected.
Pessimistic target level: 25.16
Optimistic target level: 28.13
Target values for the price of one Pfizer share for Oct 2025.
In Oct, the Negative dynamics for Pfizer Inc. shares will prevail with possible monthly volatility of 9.268% volatility is expected.
Pessimistic target level: 24.94
Optimistic target level: 27.49
Target values for the price of one Pfizer share for Nov 2025.
In Nov, the Positive dynamics for Pfizer Inc. shares will prevail with possible monthly volatility of 8.283% volatility is expected.
Pessimistic target level: 26.50
Optimistic target level: 28.90
Target values for the price of one Pfizer share for Dec 2025.
In Dec, the Negative dynamics for Pfizer Inc. shares will prevail with possible monthly volatility of 6.222% volatility is expected.
Pessimistic target level: 25.53
Optimistic target level: 27.22
Pfizer (PFE) stock dividend
Pfizer last paid dividends on 01/25/2024. The next scheduled payment will be on 03/01/2024. The amount of dividends is $1.64 per share. If the date of the next dividend payment has not been updated, it means that the issuer has not yet announced the exact payment. As soon as information becomes available, we will immediately update the data. Bookmark our portal to stay updated.
Last Split Date: 01/01/1970
Splitting of shares is an increase in the number of securities of the issuing company circulating on the market due to a decrease in their value at constant capitalization.
For example, a 5: 1 ratio means that the value of one share will decrease 5 times, the total amount will increase 5 times. It is important to understand that this procedure does not change the capitalization of the company, as well as the total value of assets held in private hands.


