


April 24, 2024 Google’s Third Cookie Phaseout Delay Amid Regulatory Hurdles
April 19, 2024 Bitcoin Halving: Catalyst for New Price Heights?
April 18, 2024 EU Moves Toward Single Capital Market Union

Amazon Web Services Expands Bedrock GenAI Service

Why Microsoft Stands Out As A Pre-Earnings Buy

Wall Street Lunch: Big Tech Bearishness?


April 23, 2024 Maximizing Profits: When is the Right Time to Sell Your Business?

April 12, 2024 Improve Your Financial Status: A How-To Guide
April 12, 2024 How ZIM Integrated Container Tracking is Revolutionizing Global Trade

March 15, 2024 6 Best Growth Stocks To Buy Now According to Metatrader 5

Pfizer (PFE) Stock Forecast for 2024–2028. Sell or Buy?
Updated: April 24, 2024 (09:40)
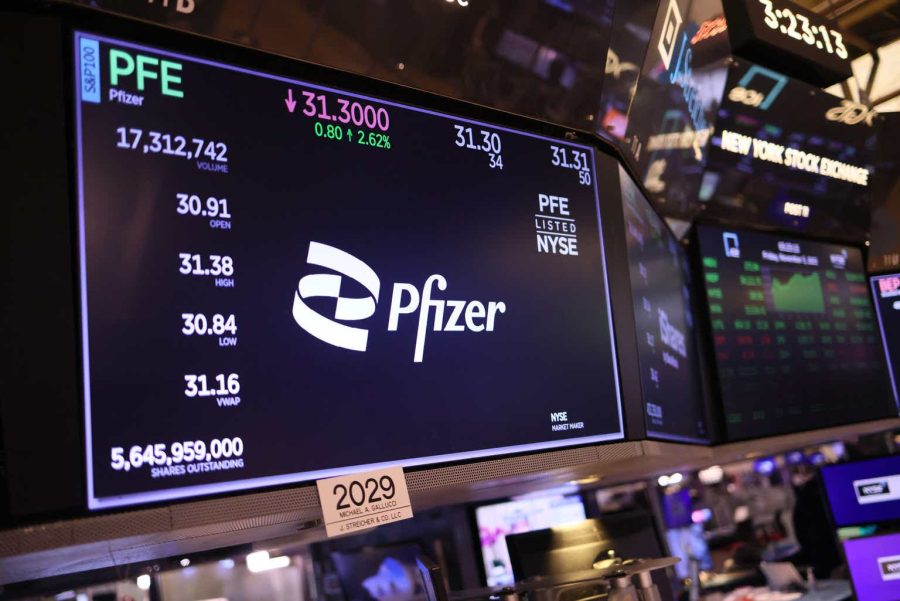
Sector: HealthcareThe share price of Pfizer Inc. (PFE) now
50/200 Day Moving Average: $27.08 / $30.69
This figure corresponds to the Average Price over the previous 50/200 days. For Pfizer stocks, the 50-day moving average is the resistance level today.
For Pfizer stocks, the 200-day moving average is the resistance level today.
Are you interested in Pfizer Inc. stocks and want to buy them, or are they already in your portfolio? If yes, then on this page you will find useful information about the dynamics of the Pfizer stock price in 2024, 2025, 2026, 2027, 2028. How much will one Pfizer share be worth in 2024 - 2028?
When should I take profit in Pfizer stock? When should I record a loss on Pfizer stock? What are analysts' forecasts for Pfizer stock? What is the future of Pfizer stock? We forecast Pfizer stock performance using neural networks based on historical data on Pfizer stocks. Also, when forecasting, technical analysis tools are used, world geopolitical and news factors are taken into account.
Pfizer stock prediction results are shown below and presented in the form of graphs, tables and text information, divided into time intervals. (Next month, 2024, 2025, 2026, 2027 and 2028) The final quotes of the instrument at the close of the previous trading day are a signal to adjust the forecasts for Pfizer shares. This happens once a day.
Historical and forecast chart of Pfizer stock
The chart below shows the historical price of Pfizer stock and a prediction chart for the next month. For convenience, prices are divided by color. Forecast prices include: Optimistic Forecast, Pessimistic Forecast, and Weighted Average Best Forecast. Detailed values for the Pfizer stock price can be found in the table below.
Long-term forecasts by years.
Pfizer's Stock Outlook: Navigating Through Uncertain Waters

In the ever-evolving landscape of the pharmaceutical industry, Pfizer (PFE) finds itself at a crucial juncture. As analysts, it's essential to dissect the myriad of factors poised to shape PFE stocks in the near future. Key events and elements, including the management of COVID-related drug revenues, surge in oncology innovations, stringent cost-saving measures, and fluctuating market sentiment, emerge as pivotal.
Decoding the Future of PFE Stocks
The dwindling sales of Comirnaty and Paxlovid have placed a spotlight on Pfizer’s financial health, making the company's performance reliant on how well it navigates post-pandemic realities. The potential stabilization or uptrend in these drug sales, buoyed by the necessity for booster shots, stands as a critical factor. Simultaneously, Pfizer's aggressive strides in oncology, marked by its acquisition of Seagen and the approval of Besponsa, highlight its growth trajectory – a tempting arena for analysts aiming to forecast stock movements. Furthermore, Pfizer's commitment to slashing costs by $4 billion by 2024 represents an untapped reservoir for bolstering profitability and, subsequently, its stock value. However, the unpredictable nature of market sentiment and investor behavior underscores the inherent challenges in making precise predictions.
For analysts, piecing together these elements is akin to solving a complex puzzle. The dynamic interplay between COVID-related drug revenues, oncology innovations, cost-saving endeavors, and market perceptions crafts a labyrinthine path to predicting Pfizer’s stock performance. Yet, in this challenge lies the opportunity to glean insights into PFE's future trajectory, making a thorough analysis indispensable.
- COVID-related drug revenues
- Oncology innovations
- Cost-saving measures
- Market sentiment and investor behavior
In essence, a multifaceted approach, adopting a keen eye on these pivotal factors, is crucial for analysts to navigate through the uncertain waters of Pfizer's stock outlook. The ability to synthesize these components will determine the accuracy of forecasts concerning PFE's stock performance in the ever-competitive pharmaceutical landscape.
Review the original Analysis

Unlocking the Future of Pfizer: A Predictive Glance at PFE Stock Movements
In the ever-evolving stock market, the trajectory of Pfizer's (PFE) stock rates seems poised for an influential shift, primarily due to several key factors that are pivotal in the short to medium-term future. Top of the list is the Seagen acquisition, a strategic move by Pfizer that is not just a testament to its vision in oncology but is also expected to significantly bolster revenue streams in the years to come, especially following the encouraging trial results of Adcetris for relapsed/refractory DLBCL.
Deciphering Stock Movements: Factors to Focus On
Furthermore, Pfizer's oncology pipeline stands out as a crucial element in predicting the company’s stock movements. With compelling assets like Padcev and disitamab vedotin, and advancements in next-generation antibody-drug conjugates (ADCs) and CDK4/6 inhibitors, this segment is anticipated to be a major driver of growth. Plus, the ongoing performance of the COVID-19 franchise, including vaccine sales and the antiviral, Paxlovid, retains a pivotal role, albeit its impact may wane compared to previous peaks.
Analysts eyeing the stock's propellants should not overlook the burgeoning obesity market. Although Pfizer’s in-house development in this arena has hit snags, potential external expansions through strategic acquisitions or partnerships could unveil new profit avenues, adding another layer of complexity to stock predictions.
In sum, understanding these factors in their entirety — from the Seagen acquisition's long-term promise to the immediate influences of Pfizer’s COVID-19 products and the potential upside of breaking into the obesity market — provides a clearer lens for analysts to forecast PFE stock movements. Accurately gauging how these elements interplay will be key to making the most informed predictions.
Review the original Analysis

Unlocking the Future: A Closer Look at PFE Stock Predictions
In the realm of pharmaceutical giants, Pfizer stands out, not just for its contribution during the COVID-19 pandemic but also for its robust portfolio and promising pipeline. As we navigate through changing healthcare landscapes, several pivotal events and factors emerge as key influencers in the trajectory of PFE stocks.
Navigating Through Uncertainties and Opportunities
The decline in revenue and profits from Covid-related products is an immediate concern as the world transitions into a post-pandemic era. This downturn could significantly impact PFE's short-term financials, making it a critical factor for analysts predicting the PFE stock price target. Conversely, the revenue growth from non-Covid products shines as a beacon of resilience, showcasing Pfizer's diversified portfolio and its potential to sustain and even grow amidst challenges.
However, looming on the horizon is the upcoming patent cliff, threatening to erode a substantial revenue stream for Pfizer. This represents the most significant risk to PFE stock forecasts, as the loss of exclusive rights could lead to a precipitous drop in sales for key drugs. Yet, it's not all doom and gloom. Pfizer's strong pipeline, brimming with potential Phase-3 winners and newly acquired projects, holds the promise of rejuvenation and growth. These innovations could be the linchpin in Pfizer's strategy to mitigate the impacts of the patent cliff, potentially making PFE stock a buy contender for savvy investors.
By analyzing these factors—ranging from the decline in profits from COVID-19 vaccines to the anticipated surge in revenue from pipeline successes—analysts can craft a nuanced Pfizer stock forecast. Consideration of these elements, in concert, allows for a more accurate prediction of PFE's financial health and stock trajectory, potentially answering the investor's perennial question: "Will PFE stock go up?"
To sum up, the road ahead for Pfizer is fraught with challenges yet ripe with opportunities. As investors and analysts peer into the future, understanding these dynamics will be crucial for making informed decisions, whether you're considering PFE stock as a buy or sell. Amidst the uncertainties, Pfizer's robust pipeline and strategic maneuvering around the patent cliff may just tip the scales, shaping the Pfizer stock price forecast in a favorable light.
Review the original Analysis
The Bright Future of PFE Stocks: An Unfolding Opportunity
In the world of high-stakes investing, few opportunities are as compelling as the case of Pfizer Inc. (NYSE:PFE). This pharmaceutical giant, standing on the threshold of its 176th year, has experienced a roller coaster in the stock market, touching a decade-low low of $26.93 per share. To understand the PFE stock forecast, it is crucial to investigate the events and factors poised to influence its performance.
The capability to predict PFE stock rates with high accuracy hinges significantly on analyzing the company’s strong fundamentals and upcoming market dynamics. Recently, the valuation of Pfizer has reached a depressed level, essentially providing a lucrative buying opportunity. Despite facing a decline in COVID-19 related product sales, Pfizer reported a commendable 7% operating sales growth in 2023, propelled by new product launches and the consistent growth of existing ones.
Factors Influencing PFE Stock Performance
Looking ahead, several core elements will play pivotal roles in shaping Pfizer’s stock trajectory. Firstly, the heavy influx of COVID-19 related revenue has bolstered Pfizer’s financial position, rendering the acquisition of Seagen—a leader in antibody-drug conjugate technology—a strategic masterstroke. This move positions Pfizer ahead in a competitive race within the pharma industry.
Moreover, while some of Pfizer’s key drugs are on the verge of hitting a patent cliff, the company’s robust and diverse pipeline promises not just to offset, but potentially eclipse, any potential shortfalls. Given these dynamics, forecasting a substantial upside for PFE stock seems not just optimistic but grounded in tangible facts and figures.
In conclusion, when contemplating the PFE stock buy or sell dilemma, it’s imperative to consider the projected EPS growth, the anticipated rise in EBITDA margins, and the transformative potential of Pfizer’s product pipeline. With an attractive dividend yield forecast of 6.19% for FY2024, the question isn’t so much ‘will PFE stock go up?’ but rather, ‘how high?’ As such, the PFE stock price target points towards an optimistic upward trend, making PFE stock an attractive proposition for both investors and analysts alike.
Pfizer Inc. stands tall as one of the global giants in the pharmaceutical industry, hailing from the United States. This powerhouse is behind a suite of well-known medications that have become household names. They’ve got Lipitor to keep cholesterol in check, Lyrica for nerve and muscle pain relief, Diflucan as an antifungal go-to, and Zithromax for bacterial infections.
There’s also the famed blue pill, Viagra, giving hope to those grappling with erectile dysfunction, while Celebrex battles arthritis and other forms of pain. Sermion comes to the aid of those with cognitive issues, Dostinex addresses hormonal imbalances, and Champix lends a hand to those determined to quit smoking.
Pfizer daily forecast for a month
| Date | Target | Pes. | Opt. | Vol., % |
|---|---|---|---|---|
| Apr 26 | 27.09 | 26.57 | 27.42 | 3.21 |
| Apr 27 | 27.51 | 27.24 | 28.23 | 3.64 |
| Apr 28 | 26.62 | 26.10 | 26.84 | 2.82 |
| Apr 29 | 26.38 | 25.79 | 26.64 | 3.29 |
| Apr 30 | 27.26 | 26.55 | 27.47 | 3.45 |
| May 01 | 26.83 | 26.15 | 27.17 | 3.91 |
| May 02 | 27.08 | 26.68 | 27.37 | 2.59 |
| May 03 | 27.01 | 26.60 | 27.32 | 2.70 |
| May 04 | 27.75 | 27.55 | 28.35 | 2.93 |
| May 05 | 27.41 | 26.73 | 27.64 | 3.41 |
| May 06 | 26.98 | 26.72 | 27.42 | 2.61 |
| May 07 | 26.55 | 25.81 | 26.88 | 4.14 |
| May 08 | 26.71 | 26.50 | 27.13 | 2.40 |
| May 09 | 27.39 | 26.65 | 27.94 | 4.86 |
| May 10 | 28.09 | 27.35 | 28.66 | 4.78 |
| May 11 | 28.05 | 27.55 | 28.36 | 2.96 |
| May 12 | 28.83 | 28.09 | 29.64 | 5.50 |
| May 13 | 29.40 | 28.86 | 29.96 | 3.81 |
| May 14 | 29.45 | 28.80 | 30.15 | 4.69 |
| May 15 | 28.74 | 27.96 | 29.16 | 4.28 |
| May 16 | 29.18 | 28.91 | 29.53 | 2.12 |
| May 17 | 28.56 | 27.86 | 28.80 | 3.37 |
| May 18 | 28.46 | 27.84 | 28.87 | 3.72 |
| May 19 | 29.08 | 28.32 | 29.84 | 5.36 |
| May 20 | 28.68 | 28.26 | 29.12 | 3.02 |
| May 21 | 28.52 | 27.73 | 29.21 | 5.36 |
| May 22 | 28.43 | 27.73 | 28.82 | 3.95 |
| May 23 | 27.67 | 27.48 | 28.03 | 2.01 |
| May 24 | 26.72 | 26.19 | 27.47 | 4.89 |
| May 25 | 27.09 | 26.88 | 27.43 | 2.05 |
Pfizer Daily Price Targets
Pfizer Stock Forecast 04-26-2024.
Forecast target price for 04-26-2024: $27.09.
Positive dynamics for Pfizer shares will prevail with possible volatility of 3.112%.
Pessimistic target level: 26.57
Optimistic target level: 27.42
Pfizer Stock Forecast 04-27-2024.
Forecast target price for 04-27-2024: $27.51.
Positive dynamics for Pfizer shares will prevail with possible volatility of 3.513%.
Pessimistic target level: 27.24
Optimistic target level: 28.23
Pfizer Stock Forecast 04-28-2024.
Forecast target price for 04-28-2024: $26.62.
Negative dynamics for Pfizer shares will prevail with possible volatility of 2.743%.
Pessimistic target level: 26.10
Optimistic target level: 26.84
Pfizer Stock Forecast 04-29-2024.
Forecast target price for 04-29-2024: $26.38.
Negative dynamics for Pfizer shares will prevail with possible volatility of 3.189%.
Pessimistic target level: 25.79
Optimistic target level: 26.64
Pfizer Stock Forecast 04-30-2024.
Forecast target price for 04-30-2024: $27.26.
Positive dynamics for Pfizer shares will prevail with possible volatility of 3.334%.
Pessimistic target level: 26.55
Optimistic target level: 27.47
Pfizer Stock Forecast 05-01-2024.
Forecast target price for 05-01-2024: $26.83.
Negative dynamics for Pfizer shares will prevail with possible volatility of 3.766%.
Pessimistic target level: 26.15
Optimistic target level: 27.17
PFE (PFE) Monthly Stock Prediction for 2024
| Month | Target | Pes. | Opt. | Vol., % |
|---|---|---|---|---|
| May. | 27.65 | 26.68 | 29.06 | 8.22 |
| Jun. | 26.40 | 24.74 | 28.14 | 12.08 |
| Jul. | 27.57 | 25.93 | 28.58 | 9.29 |
| Aug. | 25.88 | 24.46 | 26.51 | 7.73 |
| Sep. | 25.65 | 24.01 | 27.22 | 11.79 |
| Oct. | 27.56 | 26.89 | 28.41 | 5.33 |
| Nov. | 26.84 | 25.93 | 28.58 | 9.30 |
| Dec. | 25.78 | 24.43 | 26.87 | 9.07 |
Pfizer forecast for this year
Pfizer Stock Prediction for May 2024
An uptrend is forecast for this month with an optimal target price of $27.6465. Pessimistic: $26.68. Optimistic: $29.06
Pfizer Stock Prediction for Jun 2024
An downtrend is forecast for this month with an optimal target price of $26.4024. Pessimistic: $24.74. Optimistic: $28.14
Pfizer Stock Prediction for Jul 2024
An uptrend is forecast for this month with an optimal target price of $27.5668. Pessimistic: $25.93. Optimistic: $28.58
Pfizer Stock Prediction for Aug 2024
An downtrend is forecast for this month with an optimal target price of $25.8797. Pessimistic: $24.46. Optimistic: $26.51
Pfizer Stock Prediction for Sep 2024
An downtrend is forecast for this month with an optimal target price of $25.6468. Pessimistic: $24.01. Optimistic: $27.22
Pfizer Stock Prediction for Oct 2024
An uptrend is forecast for this month with an optimal target price of $27.5626. Pessimistic: $26.89. Optimistic: $28.41
Pfizer Stock Prediction for Nov 2024
An downtrend is forecast for this month with an optimal target price of $26.8432. Pessimistic: $25.93. Optimistic: $28.58
Pfizer Stock Prediction for Dec 2024
An downtrend is forecast for this month with an optimal target price of $25.7802. Pessimistic: $24.43. Optimistic: $26.87
Pfizer (PFE) Monthly Stock Prediction for 2025
| Month | Target | Pes. | Opt. | Vol., % |
|---|---|---|---|---|
| Jan | 25.90 | 24.19 | 26.43 | 8.47 |
| Feb | 27.92 | 26.72 | 28.85 | 7.40 |
| Mar | 25.59 | 24.09 | 26.99 | 10.75 |
| Apr | 25.43 | 24.01 | 25.95 | 7.50 |
| May | 24.62 | 23.25 | 25.44 | 8.62 |
| Jun | 23.56 | 22.42 | 24.32 | 7.85 |
| Jul | 25.19 | 24.26 | 26.42 | 8.15 |
| Aug | 26.06 | 24.20 | 27.51 | 12.02 |
| Sep | 25.33 | 24.03 | 26.42 | 9.06 |
| Oct | 27.17 | 25.95 | 29.08 | 10.76 |
| Nov | 27.30 | 26.68 | 29.02 | 8.04 |
| Dec | 26.63 | 24.96 | 27.23 | 8.36 |
Pfizer (PFE) Monthly Stock Prediction for 2026
| Month | Target | Pes. | Opt. | Vol., % |
|---|---|---|---|---|
| Jan | 26.47 | 24.77 | 27.42 | 9.64 |
| Feb | 26.61 | 25.00 | 28.26 | 11.52 |
| Mar | 27.11 | 26.04 | 27.92 | 6.73 |
| Apr | 28.70 | 27.85 | 29.76 | 6.42 |
| May | 27.95 | 26.04 | 28.78 | 9.53 |
| Jun | 27.52 | 26.46 | 28.19 | 6.15 |
| Jul | 27.60 | 26.58 | 28.59 | 7.04 |
| Aug | 28.14 | 27.13 | 29.69 | 8.62 |
| Sep | 27.56 | 25.92 | 29.22 | 11.29 |
| Oct | 26.52 | 25.23 | 28.14 | 10.35 |
| Nov | 25.18 | 23.64 | 25.79 | 8.35 |
| Dec | 26.11 | 25.36 | 27.43 | 7.54 |
Pfizer (PFE) Monthly Stock Prediction for 2027
| Month | Target | Pes. | Opt. | Vol., % |
|---|---|---|---|---|
| Jan | 27.68 | 26.19 | 28.93 | 9.47 |
| Feb | 28.81 | 27.69 | 29.82 | 7.13 |
| Mar | 30.18 | 29.01 | 31.21 | 7.05 |
| Apr | 29.39 | 27.67 | 31.11 | 11.05 |
| May | 28.44 | 27.11 | 29.51 | 8.15 |
| Jun | 30.54 | 28.42 | 32.33 | 12.07 |
| Jul | 33.18 | 32.07 | 34.67 | 7.49 |
| Aug | 34.52 | 32.32 | 35.39 | 8.69 |
| Sep | 32.41 | 31.74 | 34.10 | 6.93 |
| Oct | 32.47 | 30.86 | 34.07 | 9.43 |
| Nov | 32.53 | 30.59 | 33.61 | 8.97 |
| Dec | 35.22 | 33.44 | 36.87 | 9.29 |
Pfizer (PFE) Monthly Stock Prediction for 2028
| Month | Target | Pes. | Opt. | Vol., % |
|---|---|---|---|---|
| Jan | 36.71 | 36.05 | 38.00 | 5.13 |
| Feb | 37.73 | 35.73 | 39.50 | 9.54 |
| Mar | 37.15 | 35.28 | 38.79 | 9.05 |
| Apr | 40.03 | 38.88 | 42.05 | 7.54 |
| May | 40.28 | 37.74 | 42.71 | 11.63 |
| Jun | 42.39 | 40.10 | 44.45 | 9.78 |
| Jul | 46.12 | 42.89 | 48.32 | 11.25 |
| Aug | 43.88 | 41.16 | 44.83 | 8.19 |
| Sep | 42.54 | 40.09 | 43.65 | 8.16 |
| Oct | 41.12 | 39.12 | 42.90 | 8.80 |
| Nov | 38.31 | 36.24 | 39.69 | 8.69 |
| Dec | 38.79 | 37.33 | 40.99 | 8.94 |
Pfizer information and performance
235 E 42ND ST, NEW YORK, NY, US
Market capitalization of the Pfizer Inc. is the total market value of all issued shares of a company. It is calculated by the formula multiplying the number of PFE shares in the company outstanding by the market price of one share.
EBITDA of Pfizer is earnings before interest, income tax and depreciation of assets.
P/E ratio (price to earnings) - shows the ratio between the price of a share and the company's profit
Price/earnings to growth
Dividend Per Share is a financial indicator equal to the ratio of the company's net profit available for distribution to the annual average of ordinary shares.
Dividend yield is a ratio that shows how much a company pays in dividends each year at the stock price.
EPS shows how much of the net profit is accounted for by the common share.
Trailing P/E depends on what has already been done. It uses the current share price and divides it by the total earnings per share for the last 12 months.
Forward P/E uses projections of future earnings instead of final numbers.
Enterprise Value (EV) /Revenue
The EV / EBITDA ratio shows the ratio of the cost (EV) to its profit before tax, interest and amortization (EBITDA).
Number of issued ordinary shares
Number of freely tradable shares
Shares Short Prior Month - the number of shares in short positions in the last month.
Pfizer (PFE) stock dividend
Pfizer last paid dividends on 01/25/2024. The next scheduled payment will be on 03/01/2024. The amount of dividends is $1.64 per share. If the date of the next dividend payment has not been updated, it means that the issuer has not yet announced the exact payment. As soon as information becomes available, we will immediately update the data. Bookmark our portal to stay updated.
Last Split Date: 01/01/1970
Splitting of shares is an increase in the number of securities of the issuing company circulating on the market due to a decrease in their value at constant capitalization.
For example, a 5: 1 ratio means that the value of one share will decrease 5 times, the total amount will increase 5 times. It is important to understand that this procedure does not change the capitalization of the company, as well as the total value of assets held in private hands.


