


April 24, 2024 Google’s Third Cookie Phaseout Delay Amid Regulatory Hurdles
April 19, 2024 Bitcoin Halving: Catalyst for New Price Heights?
April 18, 2024 EU Moves Toward Single Capital Market Union

Amazon Web Services Expands Bedrock GenAI Service

Why Microsoft Stands Out As A Pre-Earnings Buy

Wall Street Lunch: Big Tech Bearishness?


April 23, 2024 Maximizing Profits: When is the Right Time to Sell Your Business?

April 12, 2024 Improve Your Financial Status: A How-To Guide
April 12, 2024 How ZIM Integrated Container Tracking is Revolutionizing Global Trade

March 15, 2024 6 Best Growth Stocks To Buy Now According to Metatrader 5

Ford Motor (F) Stock Forecast for 2024–2028. Sell or Buy?
Updated: April 24, 2024 (10:10)
Sector: Consumer cyclicalThe share price of Ford Motor Company (F) now
50/200 Day Moving Average: $12.59 / $12.15
This figure corresponds to the Average Price over the previous 50/200 days. For Ford Motor stocks, the 50-day moving average is the support level today.
For Ford Motor stocks, the 200-day moving average is the support level today.
Are you interested in Ford Motor Company stocks and want to buy them, or are they already in your portfolio? If yes, then on this page you will find useful information about the dynamics of the Ford Motor stock price in 2024, 2025, 2026, 2027, 2028. How much will one Ford Motor share be worth in 2024 - 2028?
When should I take profit in Ford Motor stock? When should I record a loss on Ford Motor stock? What are analysts' forecasts for Ford Motor stock? What is the future of Ford Motor stock? We forecast Ford Motor stock performance using neural networks based on historical data on Ford Motor stocks. Also, when forecasting, technical analysis tools are used, world geopolitical and news factors are taken into account.
Ford Motor stock prediction results are shown below and presented in the form of graphs, tables and text information, divided into time intervals. (Next month, 2024, 2025, 2026, 2027 and 2028) The final quotes of the instrument at the close of the previous trading day are a signal to adjust the forecasts for Ford Motor shares. This happens once a day.
Historical and forecast chart of Ford Motor stock
The chart below shows the historical price of Ford Motor stock and a prediction chart for the next month. For convenience, prices are divided by color. Forecast prices include: Optimistic Forecast, Pessimistic Forecast, and Weighted Average Best Forecast. Detailed values for the Ford Motor stock price can be found in the table below.
Long-term forecasts by years.

Electric Dreams and Economic Realities: The Forecast for Ford Motor's F Stock

When it comes to forecasting Ford Motor's F stock rates, analysts are closely watching a mix of potent dynamics set to shape the investment landscape. Key among these is the softer-than-expected demand for electric vehicles, most notably demonstrated by the production shift reduction for the F-150 Lightning. This adjustment may signal a worrying trend for Ford's ambitions in the electric vehicle (EV) market, potentially hampering F stock's performance in an increasingly competitive sector. An analyst aiming to predict the movement of F stock prices will need to keep a finger on the pulse of EV consumer demand trends and how Ford responds to these market signals.
Inflation and Charts: The Analyst's Toolkit for Navigating F Stock Predictions
Inflation's bite into consumer purchasing power emerges as another critical factor to watch. Should inflation continue its upward trajectory, it could erode the affordability of Ford's high-end EVs, impacting overall sales revenue and, ultimately, the F stock forecast. Furthermore, the technical setup of F stock presents its intrigues. With the stock price teetering close to the crucial 200-day moving average line, a breakthrough or bounce-back at this juncture could significantly influence investor sentiment and F stock price predictions.
Additionally, Ford's growth prospects, or lack thereof, provide a sobering backdrop against which the F stock price target is being assessed. Analysts contemplating whether F is a good stock to buy or if it's time to sell will dissect the company's sales growth projections, profitability pathways, and valuation in the context of these compounding challenges.
Understanding these dynamics offers a multi-dimensional view for any analyst aimed at predicting the F stock's future performance. With a holistic approach that evaluates demand for electric vehicles, inflationary pressures, technical chart setups, and sales growth prospects, an accurate Ford Motor stock forecast can be crafted, navigating the complex currents that define today's stock market.
Review the original Analysis
Navigating Ford's Financial Highway: Predicting Stock Shifts with Precision

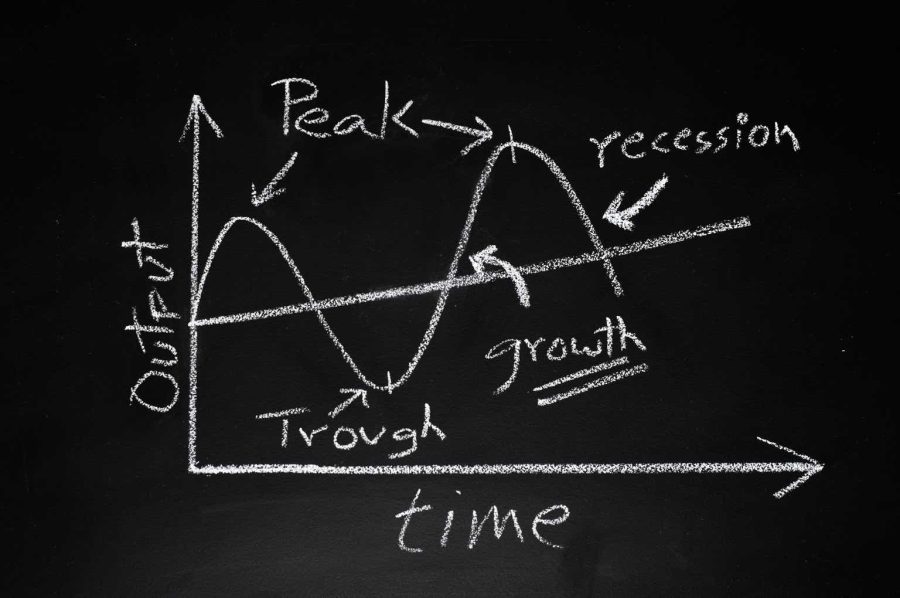
As investors and analysts scour the market for clues on the future trajectory of Ford Motor's (F) stock, understanding the intricate web of factors influencing its rates becomes pivotal. Within the automotive giant's framework, several near-future events and variables stand out for their potential to sway F stock prices significantly. Key among these are the cyclical nature of Ford's business, revenue growth coupled with profitability, inventory levels, a forward-looking growth outlook, and the prevailing interest rates affecting customer financing.
Deciphering Ford's Financial Indicators for Stock Forecasting
To dissect the future with the utmost accuracy, analysts lean heavily on evaluating these influencers. The cyclicality of Ford's business, showcasing peaks and troughs in sales and revenue, provides a telling sign of when the company might enter a phase of expansion or contraction, directly impacting the F stock forecast. Analyses rooted in understanding these patterns, alongside scrutinizing revenue growth and return on capital employed, offer a solid groundwork for making educated F stock price predictions.
Moreover, inventory levels at Ford serve as a prism through which analysts can gauge the immediate supply-demand balance, influencing short-term stock price movements. Shifting gears towards growth prospects, areas like EV production and the SUV segment's popularity promise fertile ground for F's continued expansion, making them critical components in any Ford Motor stock forecast. Lastly, the specter of rising interest rates looms large, with analysts factoring in their potential to pinch consumer wallet's thereby impacting F's sales and profitability, hence affecting the F stock price target.
In summary, for those pondering, 'Is F a good stock to buy?', or seeking the most precise Ford Motor name stock forecast, a layered analysis encompassing these pivotal factors can illuminate the path. Whether it’s a clear buy or sell Ford Motor stock decision, understanding these dynamics can equip stakeholders with the foresight needed in the ever-volatile automotive sector.
- Cyclicality of F's Business
- Revenue Growth and Profitability
- Inventory Levels
- Growth Outlook
- Interest Rates and Customer Financing


Unveiling the Future: A Close Look at Ford's Stock Projections
The landscape of the automotive industry is swiftly transforming, and at the forefront of this seismic shift are electric vehicles (EVs), dictating a new era of competitiveness. For Ford Motors, particularly known by its ticker symbol 'F', navigating this electrifying terrain while managing existing operational concerns presents a critical juncture that investors and analysts are watching closely. Understanding the factors that will drive F stock forecasts requires a deep dive into several pivotal elements.
Driving Forces Behind F Stock Predictions
Firstly, the electric vehicle market's competitiveness stands out as the most influential factor. Ford’s journey toward establishing a profitable EV segment amidst soaring competition and fluctuating consumer demand could significantly shape its stock price trajectory. Analysts looking to make accurate F stock price predictions must keenly observe Ford's adaptations and innovations in the EV space.
Additionally, concerns around debt and dividends cannot be overlooked. Despite the apprehensions, Ford's robust asset base, especially through Ford Credit, signals a manageable financial health, offering a basis for a potentially positive outlook on its stock. However, analysts must balance this against fears of bankruptcy and dividend cuts when considering if F is a good stock to buy.
Other vital considerations include inventory turnover and gross margins, where declining trends may pose warnings, and market sentiment alongside valuation multiples, reflecting investor confidence. As these elements fluctuate, they contribute to the complex matrix of factors informing F stock price predictions.
- Electric vehicle market competitiveness
- Debt and dividend sustainability
- Inventory turnover and gross margins
- Market sentiment and valuation multiples
Analysts equipped with a nuanced understanding of these dimensions are better positioned to forecast whether Ford Motor’s stock is a buy or sell. The future of F stock hinges on the company's ability to ingeniously address these challenges, dictating its position in the evolving automotive landscape and influencing F stock price target adjustments.
Review the original Analysis
The Future of Ford Stocks: A Look into the Crystal Ball
As the electric vehicle (EV) landscape continues to evolve, investors are keenly watching the movements of major players in the industry, particularly Ford Motor Company (NYSE:F). With the increasing challenges that EVs face, including consumer reticence and growing competition, it’s imperative to ask: How accurately can the F stocks be predicted, and what events and factors will most influence the change of F stocks rate?
Ford Motor stock forecast has become a topic of significant interest as the company navigates through the complexities of shifting market enthusiasm for EVs. While it’s challenging to predict stock movements with absolute certainty, Ford’s strategic positioning gives us clues. The company’s ability to blend EV innovation with its lucrative internal combustion models offers a unique hedge against the unpredictability of EV market demand. This dual approach might be a pivotal factor making F stock a potentially good buy.
Key Influences on Ford’s Stock Performance
Several near-term events and factors could notably impact Ford Motor name stock forecasts. Consumer attitudes toward EVs and the industry’s response to technological setbacks, particularly in autonomous driving, will play critical roles. Ford’s focus on less ambitious but effective technological solutions, coupled with its diversified product lineup, positions it well against competitors who are solely focused on EVs, such as Tesla.
Additionally, the company’s newer models and traditional advertising strategies could attract consumers deterred by the aesthetic stagnation and unique challenges associated with other EVs. This adaptability could be crucial for F stock price predictions as it might enable Ford to gain market share even as overall EV demand cools.
Whether F stock is a buy or sell decision depends on how investors assess these moving parts. However, Ford’s pragmatic approach to navigating the EV transition, combined with its proven track record in the automotive industry, makes the F stock price target an intriguing focus for investors. With F stock buy or sell discussions becoming more prevalent, investors are advised to keep a close eye on Ford Motor stock forecasts and the broader industry trends shaping the future of mobility.
Ford is a well-known American car manufacturer that produces vehicles under the iconic Ford brand. It’s one of the “Big Three” automakers in the United States, a title it shares with two other major players in the industry.

Ford Motor daily forecast for a month
| Date | Target | Pes. | Opt. | Vol., % |
|---|---|---|---|---|
| Apr 26 | 13.20 | 13.05 | 13.36 | 2.38 |
| Apr 27 | 13.13 | 13.02 | 13.29 | 2.06 |
| Apr 28 | 13.21 | 13.08 | 13.39 | 2.40 |
| Apr 29 | 13.08 | 12.94 | 13.19 | 1.94 |
| Apr 30 | 13.08 | 12.85 | 13.24 | 3.03 |
| May 01 | 13.21 | 13.13 | 13.28 | 1.13 |
| May 02 | 13.25 | 13.17 | 13.47 | 2.32 |
| May 03 | 13.41 | 13.32 | 13.57 | 1.91 |
| May 04 | 13.21 | 13.08 | 13.34 | 2.01 |
| May 05 | 13.02 | 12.82 | 13.17 | 2.71 |
| May 06 | 13.03 | 12.90 | 13.14 | 1.89 |
| May 07 | 12.88 | 12.70 | 12.99 | 2.34 |
| May 08 | 12.88 | 12.69 | 13.11 | 3.31 |
| May 09 | 13.10 | 12.95 | 13.23 | 2.19 |
| May 10 | 13.30 | 13.09 | 13.40 | 2.39 |
| May 11 | 13.31 | 13.13 | 13.45 | 2.43 |
| May 12 | 13.55 | 13.45 | 13.70 | 1.86 |
| May 13 | 13.63 | 13.55 | 13.74 | 1.38 |
| May 14 | 13.78 | 13.58 | 14.03 | 3.34 |
| May 15 | 13.75 | 13.56 | 13.98 | 3.14 |
| May 16 | 13.68 | 13.49 | 13.89 | 2.97 |
| May 17 | 13.69 | 13.58 | 13.94 | 2.66 |
| May 18 | 13.56 | 13.39 | 13.73 | 2.55 |
| May 19 | 13.68 | 13.42 | 13.78 | 2.67 |
| May 20 | 13.62 | 13.42 | 13.76 | 2.48 |
| May 21 | 13.82 | 13.73 | 13.92 | 1.38 |
| May 22 | 13.69 | 13.57 | 13.90 | 2.45 |
| May 23 | 13.50 | 13.32 | 13.60 | 2.09 |
| May 24 | 13.23 | 13.00 | 13.46 | 3.52 |
| May 25 | 13.22 | 13.08 | 13.43 | 2.72 |
Ford Motor Daily Price Targets
Ford Motor Stock Forecast 04-26-2024.
Forecast target price for 04-26-2024: $13.20.
Positive dynamics for Ford Motor shares will prevail with possible volatility of 2.323%.
Pessimistic target level: 13.05
Optimistic target level: 13.36
Ford Motor Stock Forecast 04-27-2024.
Forecast target price for 04-27-2024: $13.13.
Negative dynamics for Ford Motor shares will prevail with possible volatility of 2.015%.
Pessimistic target level: 13.02
Optimistic target level: 13.29
Ford Motor Stock Forecast 04-28-2024.
Forecast target price for 04-28-2024: $13.21.
Positive dynamics for Ford Motor shares will prevail with possible volatility of 2.343%.
Pessimistic target level: 13.08
Optimistic target level: 13.39
Ford Motor Stock Forecast 04-29-2024.
Forecast target price for 04-29-2024: $13.08.
Negative dynamics for Ford Motor shares will prevail with possible volatility of 1.904%.
Pessimistic target level: 12.94
Optimistic target level: 13.19
Ford Motor Stock Forecast 04-30-2024.
Forecast target price for 04-30-2024: $13.08.
Negative dynamics for Ford Motor shares will prevail with possible volatility of 2.940%.
Pessimistic target level: 12.85
Optimistic target level: 13.24
Ford Motor Stock Forecast 05-01-2024.
Forecast target price for 05-01-2024: $13.21.
Positive dynamics for Ford Motor shares will prevail with possible volatility of 1.122%.
Pessimistic target level: 13.13
Optimistic target level: 13.28
F (F) Monthly Stock Prediction for 2024
| Month | Target | Pes. | Opt. | Vol., % |
|---|---|---|---|---|
| May. | 13.87 | 12.52 | 15.08 | 16.97 |
| Jun. | 13.27 | 12.57 | 14.14 | 11.12 |
| Jul. | 13.96 | 12.75 | 14.72 | 13.38 |
| Aug. | 12.87 | 12.37 | 13.43 | 7.91 |
| Sep. | 13.45 | 12.54 | 14.20 | 11.65 |
| Oct. | 14.02 | 12.36 | 15.26 | 19.02 |
| Nov. | 13.01 | 11.88 | 14.32 | 17.04 |
| Dec. | 13.48 | 12.41 | 14.99 | 17.26 |
Ford Motor forecast for this year
Ford Motor Stock Prediction for May 2024
An uptrend is forecast for this month with an optimal target price of $13.869. Pessimistic: $12.52. Optimistic: $15.08
Ford Motor Stock Prediction for Jun 2024
An downtrend is forecast for this month with an optimal target price of $13.2657. Pessimistic: $12.57. Optimistic: $14.14
Ford Motor Stock Prediction for Jul 2024
An uptrend is forecast for this month with an optimal target price of $13.9621. Pessimistic: $12.75. Optimistic: $14.72
Ford Motor Stock Prediction for Aug 2024
An downtrend is forecast for this month with an optimal target price of $12.8731. Pessimistic: $12.37. Optimistic: $13.43
Ford Motor Stock Prediction for Sep 2024
An uptrend is forecast for this month with an optimal target price of $13.4524. Pessimistic: $12.54. Optimistic: $14.20
Ford Motor Stock Prediction for Oct 2024
An uptrend is forecast for this month with an optimal target price of $14.0174. Pessimistic: $12.36. Optimistic: $15.26
Ford Motor Stock Prediction for Nov 2024
An downtrend is forecast for this month with an optimal target price of $13.0081. Pessimistic: $11.88. Optimistic: $14.32
Ford Motor Stock Prediction for Dec 2024
An uptrend is forecast for this month with an optimal target price of $13.4764. Pessimistic: $12.41. Optimistic: $14.99
Ford Motor (F) Monthly Stock Prediction for 2025
| Month | Target | Pes. | Opt. | Vol., % |
|---|---|---|---|---|
| Jan | 14.49 | 13.66 | 15.16 | 9.89 |
| Feb | 12.88 | 11.51 | 13.30 | 13.50 |
| Mar | 11.30 | 10.21 | 12.63 | 19.18 |
| Apr | 11.23 | 9.96 | 12.19 | 18.24 |
| May | 12.00 | 10.69 | 12.63 | 15.39 |
| Jun | 13.28 | 12.48 | 14.52 | 14.00 |
| Jul | 13.58 | 12.89 | 14.45 | 10.85 |
| Aug | 13.17 | 11.91 | 14.26 | 16.49 |
| Sep | 13.33 | 12.87 | 14.71 | 12.51 |
| Oct | 12.41 | 11.78 | 13.25 | 11.10 |
| Nov | 12.32 | 11.50 | 12.93 | 11.01 |
| Dec | 12.26 | 10.99 | 13.14 | 16.37 |
Ford Motor (F) Monthly Stock Prediction for 2026
| Month | Target | Pes. | Opt. | Vol., % |
|---|---|---|---|---|
| Jan | 10.61 | 9.79 | 11.85 | 17.32 |
| Feb | 11.21 | 10.52 | 11.93 | 11.84 |
| Mar | 10.69 | 9.84 | 11.48 | 14.25 |
| Apr | 10.08 | 9.63 | 10.58 | 9.00 |
| May | 10.20 | 9.21 | 10.94 | 15.81 |
| Jun | 11.41 | 10.43 | 12.76 | 18.24 |
| Jul | 12.64 | 11.71 | 13.04 | 10.18 |
| Aug | 12.02 | 11.19 | 13.33 | 16.09 |
| Sep | 12.58 | 12.14 | 13.69 | 11.30 |
| Oct | 12.78 | 11.59 | 13.70 | 15.39 |
| Nov | 12.61 | 11.97 | 13.23 | 9.58 |
| Dec | 12.91 | 11.92 | 14.02 | 14.92 |
Ford Motor (F) Monthly Stock Prediction for 2027
| Month | Target | Pes. | Opt. | Vol., % |
|---|---|---|---|---|
| Jan | 13.09 | 12.26 | 13.64 | 10.08 |
| Feb | 13.26 | 12.01 | 14.64 | 17.94 |
| Mar | 14.32 | 13.44 | 15.22 | 11.71 |
| Apr | 13.44 | 12.79 | 14.91 | 14.20 |
| May | 14.30 | 13.75 | 15.57 | 11.71 |
| Jun | 16.32 | 15.24 | 18.28 | 16.61 |
| Jul | 18.74 | 18.01 | 20.15 | 10.60 |
| Aug | 17.99 | 16.50 | 18.98 | 13.07 |
| Sep | 18.66 | 16.59 | 20.51 | 19.11 |
| Oct | 18.46 | 17.05 | 20.54 | 16.99 |
| Nov | 18.08 | 16.59 | 19.81 | 16.29 |
| Dec | 17.32 | 15.78 | 17.86 | 11.63 |
Ford Motor (F) Monthly Stock Prediction for 2028
| Month | Target | Pes. | Opt. | Vol., % |
|---|---|---|---|---|
| Jan | 16.46 | 15.10 | 18.19 | 16.97 |
| Feb | 16.11 | 14.95 | 17.13 | 12.70 |
| Mar | 18.24 | 16.27 | 19.69 | 17.37 |
| Apr | 18.68 | 16.86 | 20.28 | 16.86 |
| May | 19.86 | 17.86 | 21.17 | 15.62 |
| Jun | 22.77 | 20.96 | 23.59 | 11.15 |
| Jul | 25.99 | 24.08 | 26.84 | 10.31 |
| Aug | 27.74 | 24.62 | 28.78 | 14.46 |
| Sep | 28.11 | 27.19 | 30.73 | 11.53 |
| Oct | 26.17 | 23.23 | 28.14 | 17.44 |
| Nov | 24.96 | 22.79 | 27.58 | 17.38 |
| Dec | 25.07 | 23.75 | 27.36 | 13.19 |
Ford Motor information and performance
ONE AMERICAN ROAD, DEARBORN, MI, US
Market capitalization of the Ford Motor Company is the total market value of all issued shares of a company. It is calculated by the formula multiplying the number of F shares in the company outstanding by the market price of one share.
EBITDA of Ford Motor is earnings before interest, income tax and depreciation of assets.
P/E ratio (price to earnings) - shows the ratio between the price of a share and the company's profit
Price/earnings to growth
Dividend Per Share is a financial indicator equal to the ratio of the company's net profit available for distribution to the annual average of ordinary shares.
Dividend yield is a ratio that shows how much a company pays in dividends each year at the stock price.
EPS shows how much of the net profit is accounted for by the common share.
Trailing P/E depends on what has already been done. It uses the current share price and divides it by the total earnings per share for the last 12 months.
Forward P/E uses projections of future earnings instead of final numbers.
Enterprise Value (EV) /Revenue
The EV / EBITDA ratio shows the ratio of the cost (EV) to its profit before tax, interest and amortization (EBITDA).
Number of issued ordinary shares
Number of freely tradable shares
Shares Short Prior Month - the number of shares in short positions in the last month.
Ford Motor (F) stock dividend
Ford Motor last paid dividends on 02/15/2024. The next scheduled payment will be on 03/01/2024. The amount of dividends is $0.6 per share. If the date of the next dividend payment has not been updated, it means that the issuer has not yet announced the exact payment. As soon as information becomes available, we will immediately update the data. Bookmark our portal to stay updated.
Last Split Date: 01/01/1970
Splitting of shares is an increase in the number of securities of the issuing company circulating on the market due to a decrease in their value at constant capitalization.
For example, a 5: 1 ratio means that the value of one share will decrease 5 times, the total amount will increase 5 times. It is important to understand that this procedure does not change the capitalization of the company, as well as the total value of assets held in private hands.


