


April 19, 2024 Bitcoin Halving: Catalyst for New Price Heights?
April 18, 2024 EU Moves Toward Single Capital Market Union
April 17, 2024 Bitcoin Halving 2024: Market Impact Predictions

Wall Street Lunch: Big Tech Bearishness?


Apple Should Climb The Wall Of Worry

Microsoft Q3 Preview: Focusing On Copilot

April 12, 2024 Improve Your Financial Status: A How-To Guide
April 12, 2024 How ZIM Integrated Container Tracking is Revolutionizing Global Trade

March 15, 2024 6 Best Growth Stocks To Buy Now According to Metatrader 5

March 6, 2024 Navigating GBP Forecast: Mistakes To Avoid In Forex Trading

Caterpillar (CAT) Stock Forecast for 2024–2028. Sell or Buy?
Updated: April 23, 2024 (02:00)
Sector: IndustrialsThe share price of Caterpillar Inc. (CAT) now
50/200 Day Moving Average: $345.11 / $289.16
This figure corresponds to the Average Price over the previous 50/200 days. For Caterpillar stocks, the 50-day moving average is the support level today.
For Caterpillar stocks, the 200-day moving average is the support level today.
Are you interested in Caterpillar Inc. stocks and want to buy them, or are they already in your portfolio? If yes, then on this page you will find useful information about the dynamics of the Caterpillar stock price in 2024, 2025, 2026, 2027, 2028. How much will one Caterpillar share be worth in 2024 - 2028?
When should I take profit in Caterpillar stock? When should I record a loss on Caterpillar stock? What are analysts' forecasts for Caterpillar stock? What is the future of Caterpillar stock? We forecast Caterpillar stock performance using neural networks based on historical data on Caterpillar stocks. Also, when forecasting, technical analysis tools are used, world geopolitical and news factors are taken into account.
Caterpillar stock prediction results are shown below and presented in the form of graphs, tables and text information, divided into time intervals. (Next month, 2024, 2025, 2026, 2027 and 2028) The final quotes of the instrument at the close of the previous trading day are a signal to adjust the forecasts for Caterpillar shares. This happens once a day.
Historical and forecast chart of Caterpillar stock
The chart below shows the historical price of Caterpillar stock and a prediction chart for the next month. For convenience, prices are divided by color. Forecast prices include: Optimistic Forecast, Pessimistic Forecast, and Weighted Average Best Forecast. Detailed values for the Caterpillar stock price can be found in the table below.
Long-term forecasts by years.
CAT Stocks Poised for Growth: What's Driving the Bullish Forecast?

With the financial world's eyes glued to the fluctuating stock market, Caterpillar Inc., trading under the ticker CAT, has emerged as a stock to watch closely. Analysts are optimistic about the Caterpillar stock forecast, attributing their positive outlook to several key factors poised to influence the company's performance in the near future.
Key Catalysts for CAT's Stock Momentum
At the forefront of these driving forces is the Infrastructure Investment and Jobs Act. This significant legislation is not just a win for infrastructure development but a green signal for increased demand in construction equipment — a sector where CAT holds significant clout. This pivotal moment is a potential goldmine for early investors, making now an intriguing time to consider if CAT stock is a buy or sell.
Further fueling the bullish CAT stock price prediction is the revitalization of American manufacturing. With the U.S. government throwing its weight behind securing critical supply chains and reshoring manufacturing efforts, Caterpillar stands to gain substantially. The company’s repertoire of high-quality machinery and equipment places it in an enviable position to capitalize on this trend.
Moreover, the global shift towards renewables emphasizes critical minerals, pushing mining activities into overdrive. Caterpillar's advanced and competitively positioned equipment for mining operations ensures its place in this wave, hinting at a robust CAT stock price target.
For those pondering whether CAT is a good stock to buy, the convergence of these factors provides a compelling narrative. By analyzing the impact of government policies and sectoral shifts, market analysts can furnish a more nuanced Caterpillar stock forecast, guiding investors towards informed decisions in purchasing or selling CAT stock. In the cascade of market dynamics, these determinants serve not just as indicators of growth but as beacons for those steering through the volatile waters of stock investment.
- The Infrastructure Investment and Jobs Act
- Revitalization of American Manufacturing
- Transition Towards Renewables
In conclusion, the trio of critical developments could very well be the catalysts for a surge in CAT stock prices, making now a fascinating juncture for investors and analysts alike to recalibrate their strategies around this promising stock.
Review the original Analysis

Unveiling Future Predictions: Navigating CAT Stock Uncertainties
The quest for accurate CAT stock forecasts encapsulates various dynamic factors that are pivotal in shaping the future rates of Caterpillar's shares. Analysts and investors alike are keenly observing a trio of critical influences that are deemed to significantly impact Caterpillar's stock movements in the coming years. At the forefront of this analysis is the concern regarding China's softened demand for infrastructure and real estate, which holds a significant sway over Caterpillar's financial health due to its substantial market presence in the region. This is closely followed by the unpredictable nature of geopolitical conflicts that continually threaten to disrupt construction and mining projects worldwide, directly affecting Caterpillar's core business sectors. Lastly, the projected modest earnings growth for Caterpillar between FY 2024 and FY 2026 raises eyebrows, suggesting a potential stagnation that could deter investors seeking lucrative returns.
Deciphering CAT's Stock Trajectory: Analyst Perspective
For an analyst aiming to forecast the Cat stock price with precision, understanding the intricate balance between these factors becomes paramount. China's real estate and infrastructure downturn, characterized by slumping sales and developer defaults, necessitates a keen insight into global economic policies and consumer behavior trends as they unfold. Similarly, monitoring geopolitical developments provides a real-time barometer for adjusting predictions reflective of current events that could influence Caterpillar's operational landscape. Above all, gauging Caterpillar's strategic initiatives to spur earnings amidst a forecasted period of moderate growth is crucial. This comprehensive approach not only enhances the accuracy of CAT stock price predictions but also informs decisions on whether CAT stock is a buy or sell. Leveraging these insights could pave the way for anticipating fluctuations in Caterpillar's stock rates, thereby equipping investors with the knowledge to make informed decisions in an ever-evolving financial marketplace.
- China's Softened Demand
- Geopolitical Conflicts
- Earnings Growth
As investors navigate the Caterpillar stock forecast, these crucial elements serve as the beacon for assessing CAT’s future trajectory, offering a nuanced perspective on whether Caterpillar stock is a good buy or a sell. Therefore, understanding the intertwined impact of these factors will be essential for anyone looking to make an informed CAT stock price prediction or set a realistic CAT stock price target.
Review the original Analysis

Unlocking the Future: Navigating Caterpillar Stock Predictions
As financial analysts and investors closely monitor Caterpillar's stock forecast, a nuanced understanding of the dynamic factors influencing CAT stock prices becomes crucial. Among the pivotal events and trends anticipated to shape the trajectory of CAT's valuation, several stand out for their potency in driving change.
The Core Pillars Underpinning the Forecast
The manufacturing and infrastructure sectors are undergoing substantial transformation, driven by heightened infrastructure spending and the pressing need for decarbonization and electrification. This industry evolution presents a fertile ground for Caterpillar, with its sturdy competitive position and diversified machinery portfolio, to capture significant growth opportunities. Analysts eyeing the CAT stock price prediction are particularly attuned to these industry tailwinds, projected to propel the industry at a compelling CAGR of +7% into 2033.
Moreover, Caterpillar's financial prowess provides a solid foundation for its stock buy or sell decisions. A combination of consistent margin improvement and robust free cash flow generation underlines its propensity for value creation, pivotal for those deliberating is CAT a good stock to buy. However, potential investors are advised to navigate with caution; Caterpillar's current premium valuation against its historical average and peers suggests limited upside, tempering overly enthusiastic CAT stock price targets.
To forge the most accurate forecasts, analysts must balance these influencing factors: Caterpillar's competitive edge, industry growth prospects, financial health, and current valuation. Weighing the company’s inherent strengths against its market valuation intricacies will be key in determining whether to buy or sell Caterpillar stock. As the landscape evolves, these considerations promise to guide astute predictions on the future rates of CAT stocks.
Review the original Analysis
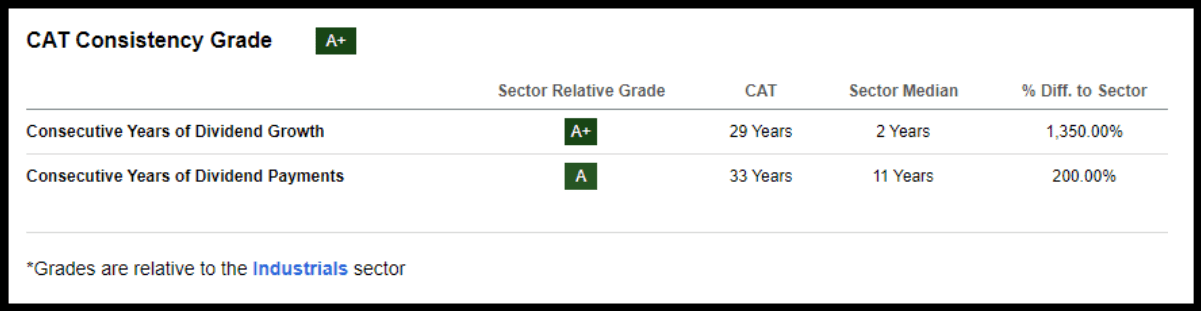
Caterpillar Inc. is revolutionizing the industrial sphere with its cutting-edge construction and machinery operations, logistics integration, and service distribution. Apart from leveraging artificial intelligence in autonomous machinery, Caterpillar also stands out for its exceptional dividend growth, which spans years, as opposed to the industry average of two years—a whopping 1,350% difference.
Caterpillar’s consistency grade reveals some tempting valuation metrics. The company’s forward P/E sits at an appealing 14.66x when compared to the industry’s 19.53x. Its forward PEG also beats the industry average at 1.06x compared to 1.66x.
With heightened demand for construction equipment, CAT benefited from corporate restocks in the first half of 2023. As a global heavy machinery leader, Caterpillar will likely see a boost in sales growth as economies rebound and U.S. infrastructure spending climbs.
In the past 90 days alone, strong earnings exceeding predictions have triggered 24 FY1 upward analyst revisions. The second quarter reported an EPS of $5.55 that outrightly outperformed by $0.97 and revenues shot up nearly 22% year-over-year at $17.32 billion.
Company CEO James Umpleby shed light on CAT’s robust dividend growth grade and free cash flow performance during a recent Q2 earnings call.
He announced a healthy ME&T free cash flow of $2.6 billion collected during Q2 itself, wherein they returned $2 billion to shareholders—$1.4 billion via stock repurchase and $600 million through dividends.
Umpleby proudly stated an anticipated dividend increase of 8%, resulting in a quarterly dividend per share climbing by an impressive 51% since May 2019 when they launched their existing capital allocation strategy.
Caterpillar solidifies its stance as a dependable investment option with its commendable dividend scorecard which includes a 26.82% dividend payout ratio, superior B+ dividend safety grade, and a five-year growth rate of 8.9%. These promising facets make Caterpillar a worthy contestant for your investment portfolio inclusion.
The Reasons Why You Should Consider Buying Caterpillar
Caterpillar stands out as a solid investment choice, particularly because it boasts the status of a dividend aristocrat, with over 25 successive years of increasing dividends—a testament to its financial resilience. Despite its stock taking a hit and tumbling from nearly $300 down to about $226 in the past three months, savvy investors might see this as a buying opportunity, seeing that shares have since rebounded to around $246.
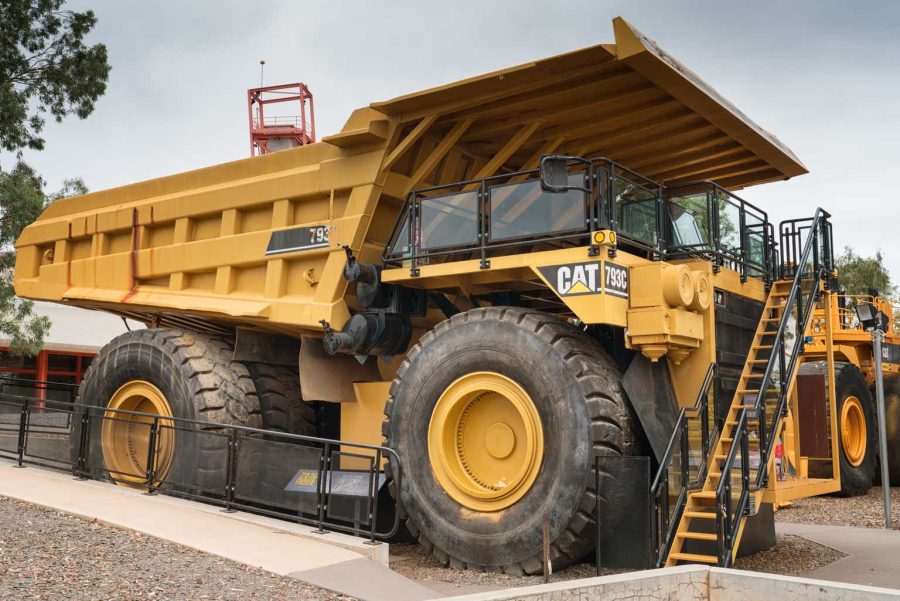
This company is a mainstay in the construction and mining sectors, known for manufacturing heavy-duty equipment that’s crucial for infrastructure development. Whether you pass by a construction site on your way to work or notice renovations at your local shopping center, there’s a good chance Caterpillar machinery is at the heart of these projects. With an ever-present demand for construction and development, Caterpillar’s foothold in supplying necessary equipment seems robust.
Considering this strong market position, it’s logical for an investor to consider Caterpillar as a potentially lucrative long-term bet. The pertinent questions remain about the company’s capacity for growth and its future outlook, but with its indispensable role in ongoing global development, Caterpillar appears well-positioned for enduring success.
Conservative Growth Outlook
Caterpillar has been growing earnings at a modest rate of around 3% a year, and despite a less rosy forecast compared to the last five years, they still favor the slow but stable progress. Overall financial metrics are ticking up slightly, with earnings and revenue expected to inch up by around 1.7% and 3.2%, while operating cash flow and free cash flow are looking at around 4% growth over the next couple of years.
Even though these numbers aren’t eye-popping, given the shaky economic outlook and potential recession on the horizon, this kind of growth is seen as commendable. What’s more, Caterpillar has surpassed expectations with a solid latest earnings report—sales are up 12%, profit margins have improved, and they’ve generated significant free cash flow while continuing to reward shareholders generously through buybacks and dividends.
Solid Financial Standing
One key aspect that labels a stock as top-tier is its robust financial health. By the conclusion of the recent quarter, Caterpillar (CAT) had an impressive $6.5 billion nest egg on hand, backed up by a sturdy interest coverage ratio. Plus, they’d stashed away an extra $4.3 billion in slightly longer-term liquid stocks to pump up returns on their cash reserves.
When matched against other market players, CAT flaunts one of the lowest net debt-to-EBITDA ratios at a minor 0.47x—well below competitors such as Cummins Inc. (CMI), and Deere & Co.(DE), both clocking in 1.10x apiece. Although CAT’s debt has seen a marginal uptick over the past years, the company has managed to keep its cash and debt balance steady.
Compared to its rivals, though, CAT does shoulder a significantly larger debt that might ruffle feathers among investors, especially considering the current high interest rate scenario. However, for a large-cap company with a fortified competitive advantage like Caterpillar, this is hardly cause for sleepless nights.

Caterpillar daily forecast for a month
| Date | Target | Pes. | Opt. | Vol., % |
|---|---|---|---|---|
| Apr 24 | 363.07 | 358.63 | 367.07 | 2.35 |
| Apr 25 | 360.81 | 355.03 | 365.77 | 3.02 |
| Apr 26 | 364.14 | 360.32 | 369.06 | 2.43 |
| Apr 27 | 357.50 | 350.35 | 360.98 | 3.04 |
| Apr 28 | 354.46 | 348.79 | 358.45 | 2.77 |
| Apr 29 | 360.66 | 355.97 | 362.65 | 1.87 |
| Apr 30 | 361.65 | 356.14 | 368.34 | 3.43 |
| May 01 | 359.75 | 354.09 | 362.27 | 2.31 |
| May 02 | 367.67 | 360.41 | 374.65 | 3.95 |
| May 03 | 364.64 | 359.26 | 366.82 | 2.11 |
| May 04 | 357.71 | 354.94 | 360.48 | 1.56 |
| May 05 | 359.14 | 352.94 | 362.19 | 2.62 |
| May 06 | 362.55 | 355.30 | 365.27 | 2.81 |
| May 07 | 358.38 | 354.89 | 362.95 | 2.27 |
| May 08 | 364.38 | 358.55 | 369.03 | 2.92 |
| May 09 | 373.04 | 368.38 | 378.17 | 2.66 |
| May 10 | 372.39 | 370.24 | 377.41 | 1.94 |
| May 11 | 376.11 | 372.35 | 380.81 | 2.27 |
| May 12 | 366.71 | 359.83 | 371.02 | 3.11 |
| May 13 | 365.61 | 360.12 | 368.90 | 2.44 |
| May 14 | 363.78 | 361.32 | 369.78 | 2.34 |
| May 15 | 365.05 | 358.66 | 371.99 | 3.71 |
| May 16 | 364.32 | 360.04 | 367.60 | 2.10 |
| May 17 | 365.60 | 359.66 | 367.97 | 2.31 |
| May 18 | 364.87 | 362.95 | 370.98 | 2.21 |
| May 19 | 361.40 | 358.78 | 365.46 | 1.86 |
| May 20 | 355.17 | 350.99 | 360.40 | 2.68 |
| May 21 | 353.66 | 351.62 | 356.31 | 1.33 |
| May 22 | 352.24 | 346.96 | 356.03 | 2.61 |
| May 23 | 348.28 | 346.28 | 352.28 | 1.74 |
Caterpillar Daily Price Targets
Caterpillar Stock Forecast 04-24-2024.
Forecast target price for 04-24-2024: $363.07.
Positive dynamics for Caterpillar shares will prevail with possible volatility of 2.300%.
Pessimistic target level: 358.63
Optimistic target level: 367.07
Caterpillar Stock Forecast 04-25-2024.
Forecast target price for 04-25-2024: $360.81.
Negative dynamics for Caterpillar shares will prevail with possible volatility of 2.935%.
Pessimistic target level: 355.03
Optimistic target level: 365.77
Caterpillar Stock Forecast 04-26-2024.
Forecast target price for 04-26-2024: $364.14.
Positive dynamics for Caterpillar shares will prevail with possible volatility of 2.368%.
Pessimistic target level: 360.32
Optimistic target level: 369.06
Caterpillar Stock Forecast 04-27-2024.
Forecast target price for 04-27-2024: $357.50.
Negative dynamics for Caterpillar shares will prevail with possible volatility of 2.946%.
Pessimistic target level: 350.35
Optimistic target level: 360.98
Caterpillar Stock Forecast 04-28-2024.
Forecast target price for 04-28-2024: $354.46.
Negative dynamics for Caterpillar shares will prevail with possible volatility of 2.695%.
Pessimistic target level: 348.79
Optimistic target level: 358.45
Caterpillar Stock Forecast 04-29-2024.
Forecast target price for 04-29-2024: $360.66.
Positive dynamics for Caterpillar shares will prevail with possible volatility of 1.840%.
Pessimistic target level: 355.97
Optimistic target level: 362.65
CAT (CAT) Monthly Stock Prediction for 2024
| Month | Target | Pes. | Opt. | Vol., % |
|---|---|---|---|---|
| May. | 342.96 | 321.69 | 362.51 | 11.26 |
| Jun. | 330.61 | 313.75 | 352.43 | 10.98 |
| Jul. | 320.03 | 308.83 | 336.35 | 8.18 |
| Aug. | 296.99 | 277.09 | 319.26 | 13.21 |
| Sep. | 291.64 | 272.39 | 299.52 | 9.06 |
| Oct. | 289.60 | 279.47 | 308.71 | 9.47 |
| Nov. | 291.63 | 269.76 | 303.00 | 10.97 |
| Dec. | 280.26 | 263.44 | 288.38 | 8.65 |
Caterpillar forecast for this year
Caterpillar Stock Prediction for May 2024
An downtrend is forecast for this month with an optimal target price of $342.956. Pessimistic: $321.69. Optimistic: $362.51
Caterpillar Stock Prediction for Jun 2024
An downtrend is forecast for this month with an optimal target price of $330.61. Pessimistic: $313.75. Optimistic: $352.43
Caterpillar Stock Prediction for Jul 2024
An downtrend is forecast for this month with an optimal target price of $320.03. Pessimistic: $308.83. Optimistic: $336.35
Caterpillar Stock Prediction for Aug 2024
An downtrend is forecast for this month with an optimal target price of $296.988. Pessimistic: $277.09. Optimistic: $319.26
Caterpillar Stock Prediction for Sep 2024
An downtrend is forecast for this month with an optimal target price of $291.642. Pessimistic: $272.39. Optimistic: $299.52
Caterpillar Stock Prediction for Oct 2024
An downtrend is forecast for this month with an optimal target price of $289.601. Pessimistic: $279.47. Optimistic: $308.71
Caterpillar Stock Prediction for Nov 2024
An uptrend is forecast for this month with an optimal target price of $291.628. Pessimistic: $269.76. Optimistic: $303.00
Caterpillar Stock Prediction for Dec 2024
An downtrend is forecast for this month with an optimal target price of $280.255. Pessimistic: $263.44. Optimistic: $288.38
Caterpillar (CAT) Monthly Stock Prediction for 2025
| Month | Target | Pes. | Opt. | Vol., % |
|---|---|---|---|---|
| Jan | 280.82 | 263.97 | 295.98 | 10.82 |
| Feb | 296.54 | 276.97 | 308.11 | 10.11 |
| Mar | 279.64 | 258.11 | 286.07 | 9.78 |
| Apr | 273.49 | 266.65 | 286.89 | 7.05 |
| May | 273.76 | 263.36 | 284.16 | 7.32 |
| Jun | 299.22 | 286.95 | 314.78 | 8.84 |
| Jul | 291.14 | 279.49 | 299.00 | 6.52 |
| Aug | 297.84 | 281.46 | 310.35 | 9.31 |
| Sep | 299.03 | 282.28 | 313.38 | 9.92 |
| Oct | 319.66 | 298.56 | 341.40 | 12.55 |
| Nov | 343.00 | 326.53 | 359.12 | 9.07 |
| Dec | 327.56 | 313.80 | 339.03 | 7.44 |
Caterpillar (CAT) Monthly Stock Prediction for 2026
| Month | Target | Pes. | Opt. | Vol., % |
|---|---|---|---|---|
| Jan | 297.75 | 291.20 | 320.68 | 9.19 |
| Feb | 300.14 | 281.53 | 322.65 | 12.74 |
| Mar | 271.02 | 258.01 | 289.99 | 11.03 |
| Apr | 282.41 | 262.35 | 302.17 | 13.18 |
| May | 292.01 | 274.49 | 304.27 | 9.79 |
| Jun | 317.41 | 301.22 | 328.52 | 8.31 |
| Jul | 336.14 | 327.06 | 351.60 | 6.98 |
| Aug | 323.37 | 315.28 | 345.35 | 8.71 |
| Sep | 322.40 | 306.28 | 341.74 | 10.38 |
| Oct | 324.33 | 313.63 | 347.03 | 9.63 |
| Nov | 294.17 | 272.69 | 313.29 | 12.96 |
| Dec | 294.46 | 285.33 | 300.35 | 5.00 |
Caterpillar (CAT) Monthly Stock Prediction for 2027
| Month | Target | Pes. | Opt. | Vol., % |
|---|---|---|---|---|
| Jan | 289.75 | 280.77 | 299.60 | 6.29 |
| Feb | 315.83 | 304.46 | 327.51 | 7.04 |
| Mar | 306.35 | 297.16 | 326.88 | 9.09 |
| Apr | 294.10 | 273.22 | 299.98 | 8.92 |
| May | 312.04 | 303.30 | 328.89 | 7.78 |
| Jun | 311.41 | 295.22 | 330.72 | 10.73 |
| Jul | 312.04 | 291.75 | 319.84 | 8.78 |
| Aug | 313.60 | 306.38 | 319.87 | 4.22 |
| Sep | 312.97 | 292.31 | 332.69 | 12.14 |
| Oct | 322.99 | 302.96 | 345.92 | 12.42 |
| Nov | 314.91 | 294.13 | 326.25 | 9.85 |
| Dec | 331.92 | 310.01 | 338.89 | 8.52 |
Caterpillar (CAT) Monthly Stock Prediction for 2028
| Month | Target | Pes. | Opt. | Vol., % |
|---|---|---|---|---|
| Jan | 357.47 | 347.11 | 384.64 | 9.76 |
| Feb | 339.96 | 313.10 | 364.09 | 14.01 |
| Mar | 369.87 | 342.87 | 380.60 | 9.91 |
| Apr | 391.33 | 372.93 | 399.15 | 6.57 |
| May | 372.54 | 346.84 | 399.74 | 13.23 |
| Jun | 403.84 | 382.84 | 424.43 | 9.80 |
| Jul | 412.72 | 393.74 | 441.20 | 10.76 |
| Aug | 424.69 | 405.15 | 443.38 | 8.62 |
| Sep | 420.44 | 402.78 | 432.63 | 6.90 |
| Oct | 388.91 | 370.63 | 402.13 | 7.83 |
| Nov | 371.80 | 352.09 | 379.98 | 7.34 |
| Dec | 378.86 | 351.58 | 399.32 | 11.95 |
Caterpillar information and performance
510 LAKE COOK ROAD, SUITE 100, DEERFIELD, IL, US
Market capitalization of the Caterpillar Inc. is the total market value of all issued shares of a company. It is calculated by the formula multiplying the number of CAT shares in the company outstanding by the market price of one share.
EBITDA of Caterpillar is earnings before interest, income tax and depreciation of assets.
P/E ratio (price to earnings) - shows the ratio between the price of a share and the company's profit
Price/earnings to growth
Dividend Per Share is a financial indicator equal to the ratio of the company's net profit available for distribution to the annual average of ordinary shares.
Dividend yield is a ratio that shows how much a company pays in dividends each year at the stock price.
EPS shows how much of the net profit is accounted for by the common share.
Trailing P/E depends on what has already been done. It uses the current share price and divides it by the total earnings per share for the last 12 months.
Forward P/E uses projections of future earnings instead of final numbers.
Enterprise Value (EV) /Revenue
The EV / EBITDA ratio shows the ratio of the cost (EV) to its profit before tax, interest and amortization (EBITDA).
Number of issued ordinary shares
Number of freely tradable shares
Shares Short Prior Month - the number of shares in short positions in the last month.
Caterpillar (CAT) stock dividend
Caterpillar last paid dividends on 04/19/2024. The next scheduled payment will be on 05/20/2024. The amount of dividends is $5.1 per share. If the date of the next dividend payment has not been updated, it means that the issuer has not yet announced the exact payment. As soon as information becomes available, we will immediately update the data. Bookmark our portal to stay updated.
Last Split Date: 01/01/1970
Splitting of shares is an increase in the number of securities of the issuing company circulating on the market due to a decrease in their value at constant capitalization.
For example, a 5: 1 ratio means that the value of one share will decrease 5 times, the total amount will increase 5 times. It is important to understand that this procedure does not change the capitalization of the company, as well as the total value of assets held in private hands.


